
Figure 1.
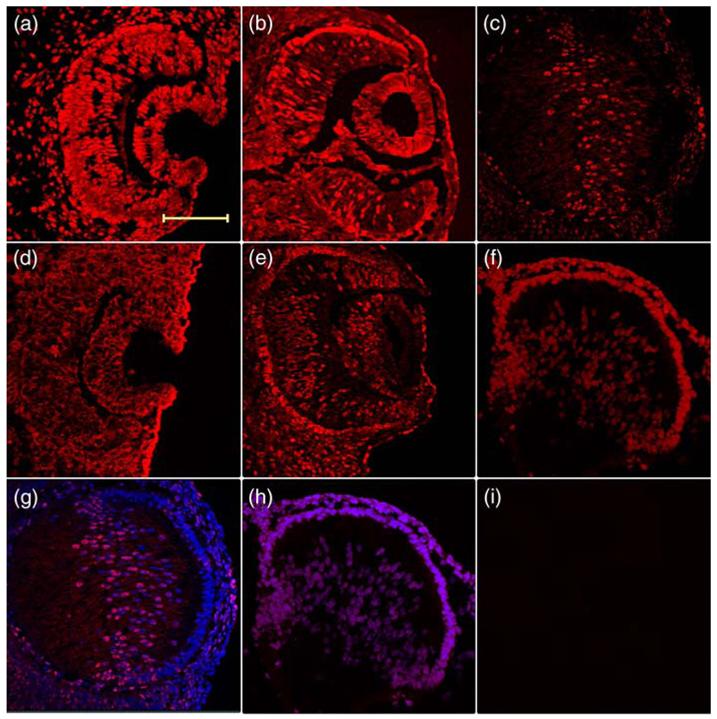
Different expression pattern of CBP and p300 during mouse lens development. Immunohistochemistry was used to test the expression of (a)-(c) CBP and (d)-(f) p300 on (a) and (d) E10.5, (b) and (e) E11.5 and (c), (f)-(i) E14.5 mouse lenses cryosections. Merged images with DAPI to show the (g) CBP and (h) p300 expression at E14.5. An experiment without the primary antibody is shown in (i). The scale bar represents 100 μm, and same magnification was used in all pictures.