
Figure 4.
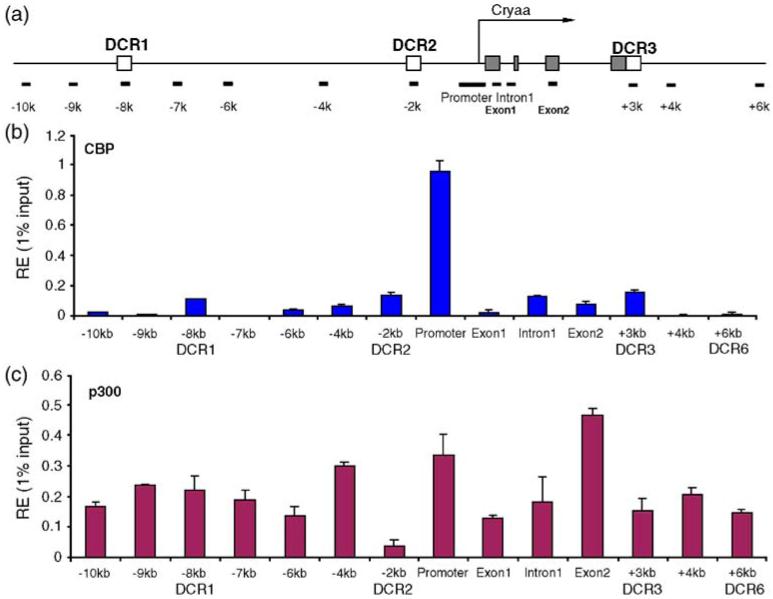
Interaction and distribution of CBP and p300 at the mouse αA-crystallin locus in chromatin of newborn lens. (a) A diagram of the αA-crystallin locus showing positions of PCR amplicons (see the legend to Figure 3(a)). (b) Distribution of CBP, (c) distribution of p300. The relative enrichment unit represents 1% of the input. The background for each region was subtracted as described.17