
Figure 5.
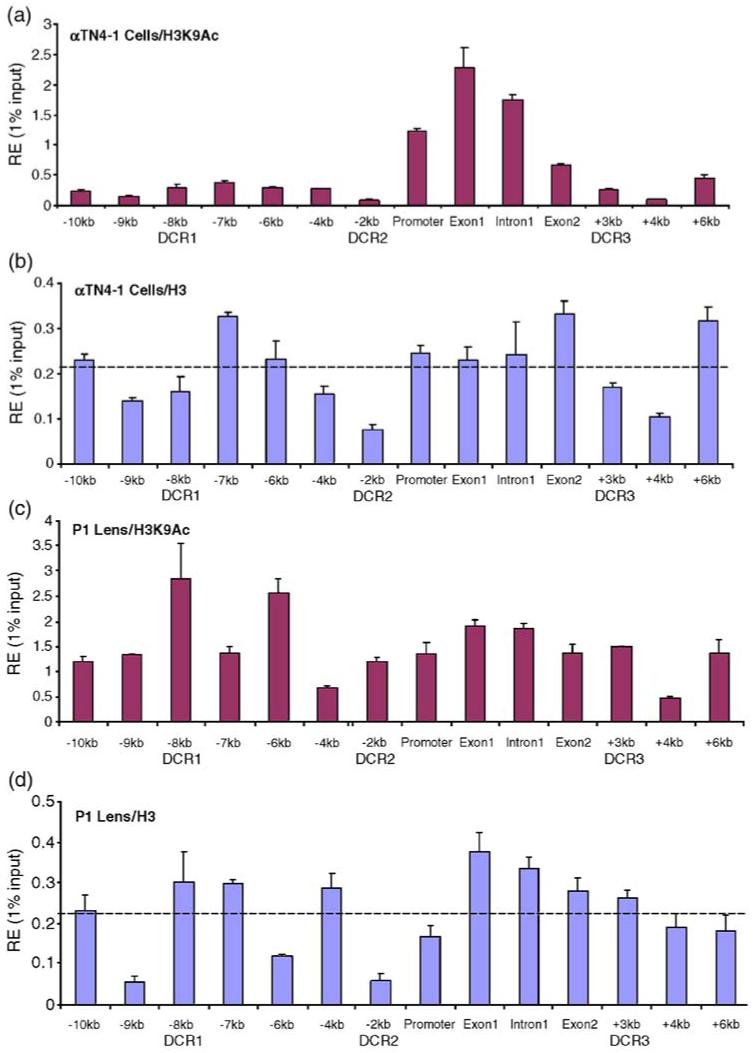
ChIP analyses of the distribution of the H3K9ac and total H3 at the mouse αA-crystallin locus. (a) Distribution of H3 K9ac and (b) total H3 signals in chromatin obtained from cultured lens epithelial cells. (c) Distribution of H3 K9ac and (d) total H3 signals in chromatin prepared from newborn mouse lenses. Dotted lines in (b) and (d) represent average signals of total H3 calculated from 14 positions across of the αA-crystallin locus.