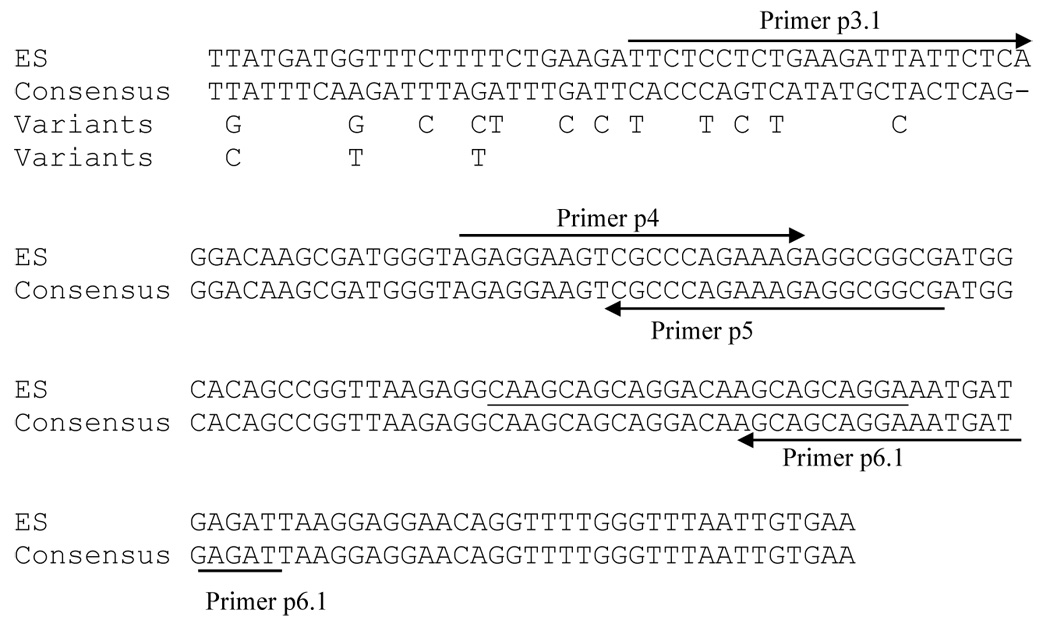
Figure 6. Comparison of expression-site to sequences (ES) upstream of MSG genes not at the expression site.

The top line of sequence is from the expression site. The second line is the consensus sequence derived from regions upstream of 11 MSG genes that are not at the expression site. The dash indicates a gap in the sequence alignment. The third and fourth lines show sequence polymorphisms in the regions upstream of MSG gene that are not at the expression site. The locations of the sequences that bind PCR primers p3.1, p4, p5 and p6.1 are shown by arrows. The 24 bases underlined contain 2 copies of a 12 base repeat. A third copy of this repeat was present in some sequences.
