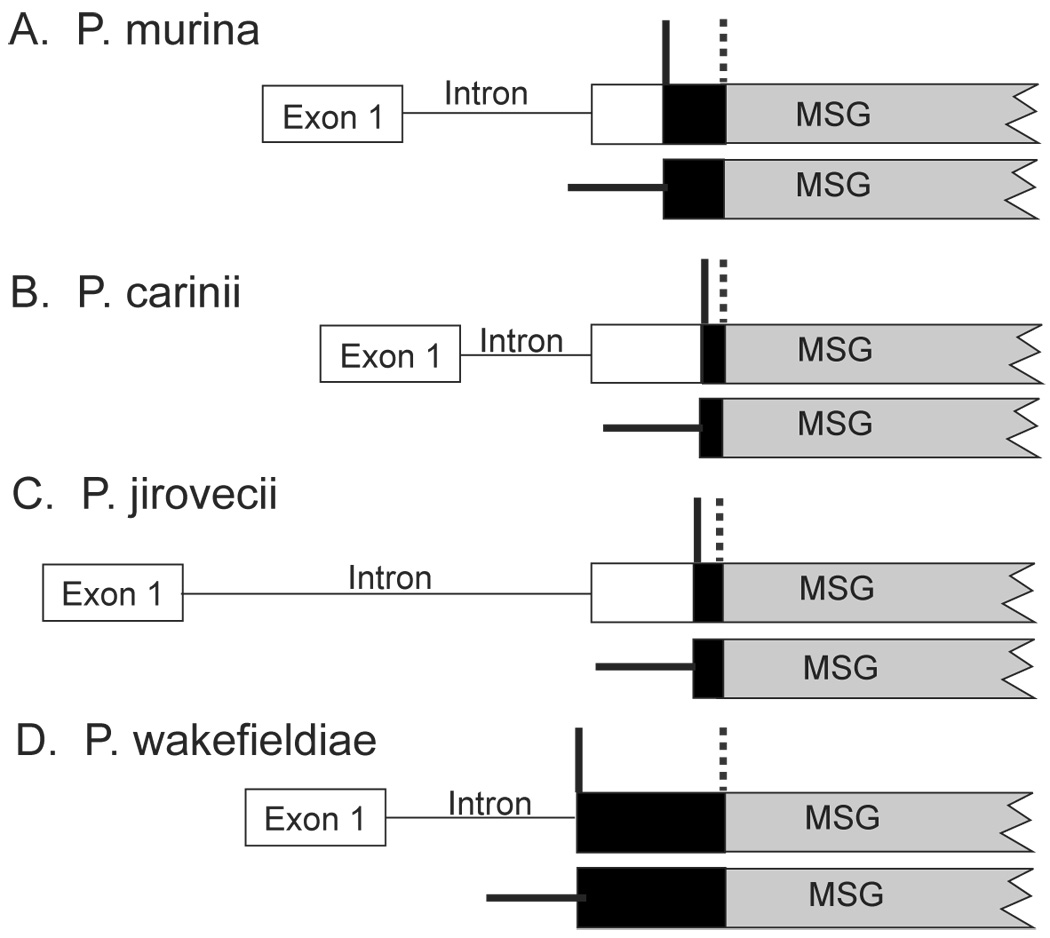
Figure 8. Comparison of expression sites in four Pneumocystis species.

For each species, two maps are shown. The upper map depicts the expresson site and the beginning of an expression-site-linked MSG gene. The lower map depicts an MSG gene not linked to the expression site. The symbol │ indicates the boundary between unique and repeated DNA at the expression site. The region to the left of the line contains DNA that is present only once in the haploid genome of P. murina. The region to the right of the line contains DNA that is a member of a family of sequences located throughout the genome. The symbol  marks the boundary between the UCS and MSG sequences. The black boxes represent CRJEs, defined as the 5-prime sequence that is conserved among all members of the MSG gene family in a given species.
