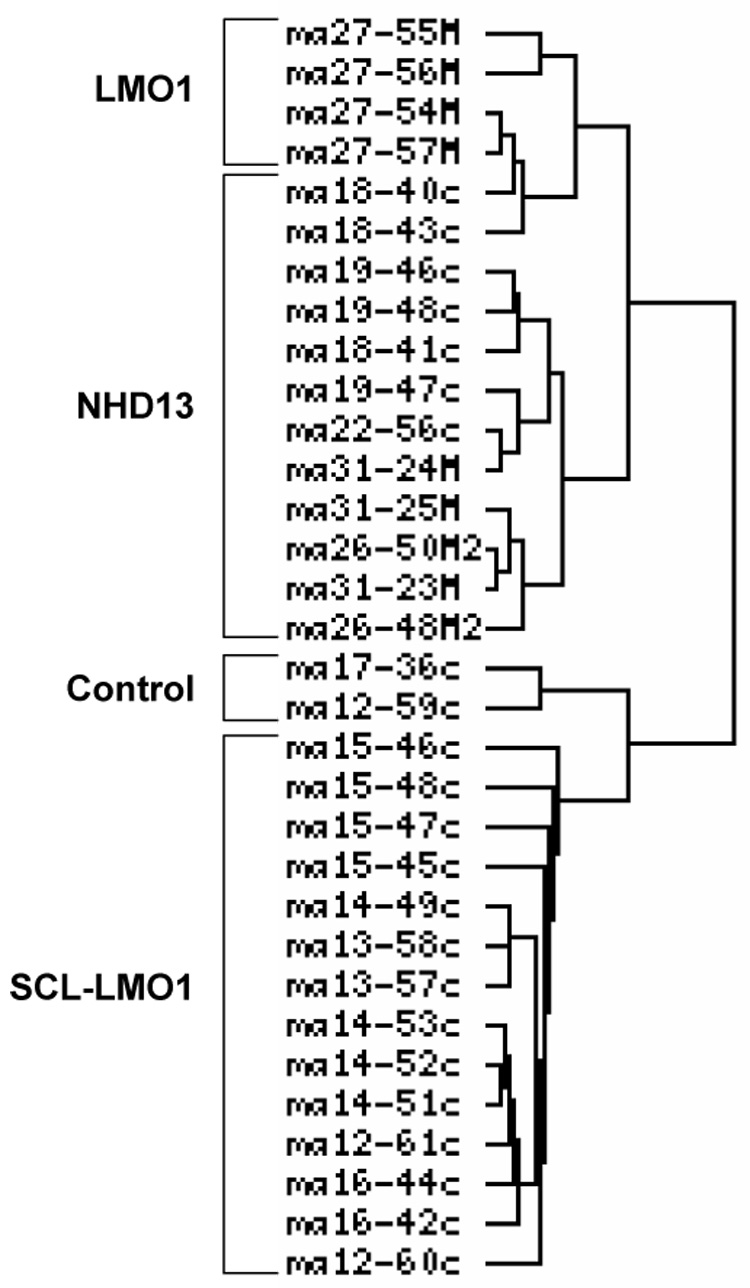
Figure 1. Hierarchical clustering of murine pre-T LBL gene expression profiles.

Hierarchical clustering was determined using the classical Pearson method. The first hierarchical break distinguished a group of the LMO1 and NHD13 tumors from the group of the SCL-LMO1 tumors and normal thymus.
