
Figure 3. Growth of differentiated NHD13 cells in liquid culture.
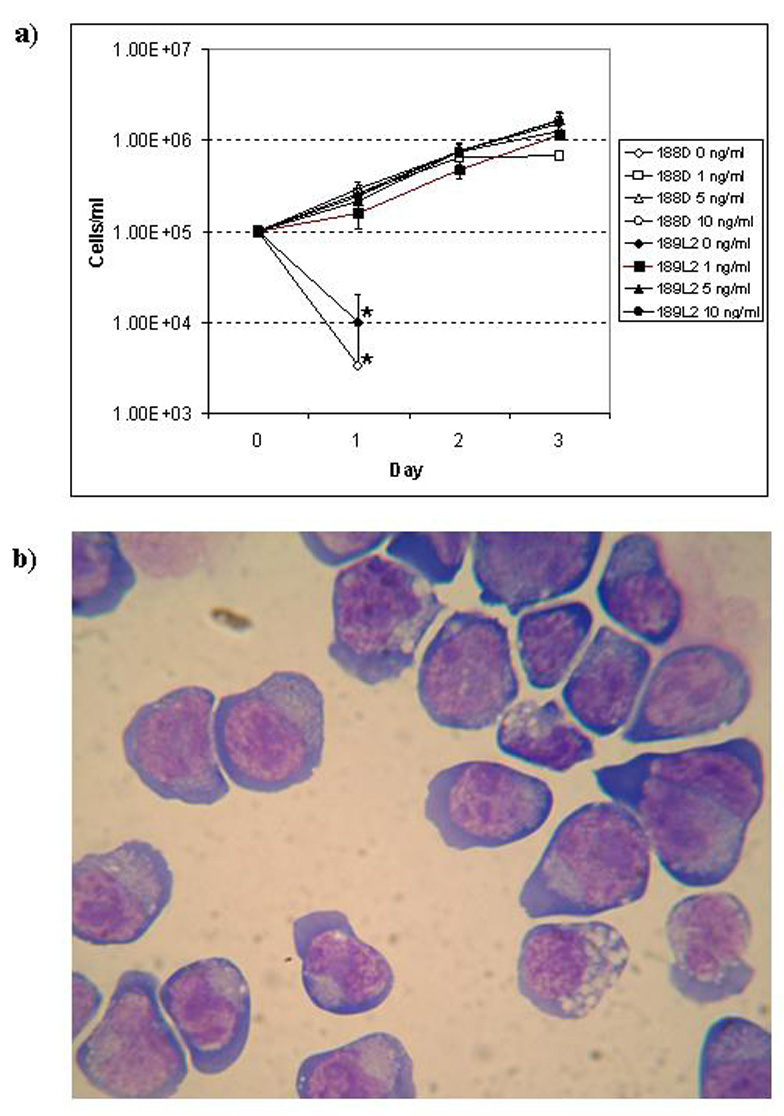
a) Growth curve of 188D and 189L2 cell lines in various concentrations of IL3. Asterisks indicate the last data point that could be plotted, as no viable cells were identified under these conditions after day 1. b) Wright-Giemsa stained cytospin of 188D cell line. Note deep basophilic cytoplasm, perinuclear clearing, and nuclear blebbing.