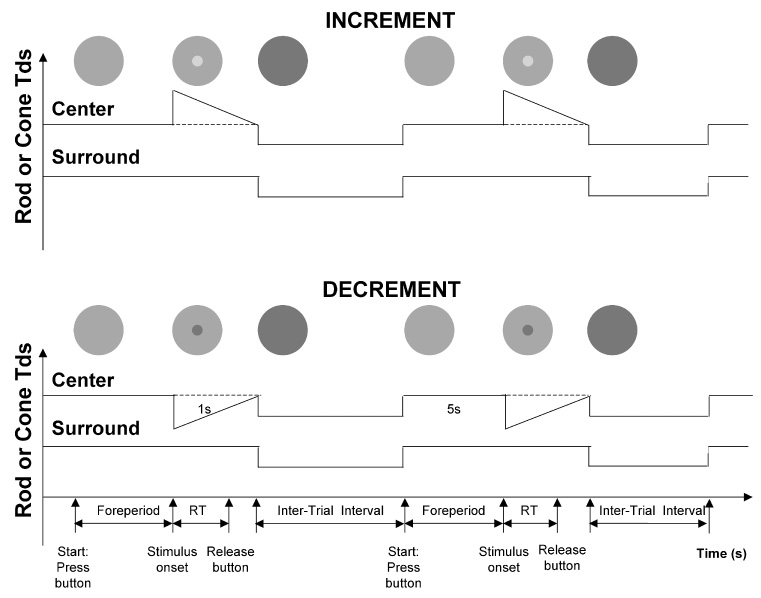
Figure 1.

The schematic protocols of reaction time measurement for incremental and decremental stimuli. The observer first held a button. After a 5000 ms foreperiod, the rod or cone signal in the center (2° in diameter) was incremented (upper) or decremented (lower) in a 1-sec ramp waveform. The observer released the button as quickly as possible once a change in the center was detected. During the interstimulus interval, the retinal illuminance was reduced by 40% from the adaptation level to avoid Troxler’s effect.
