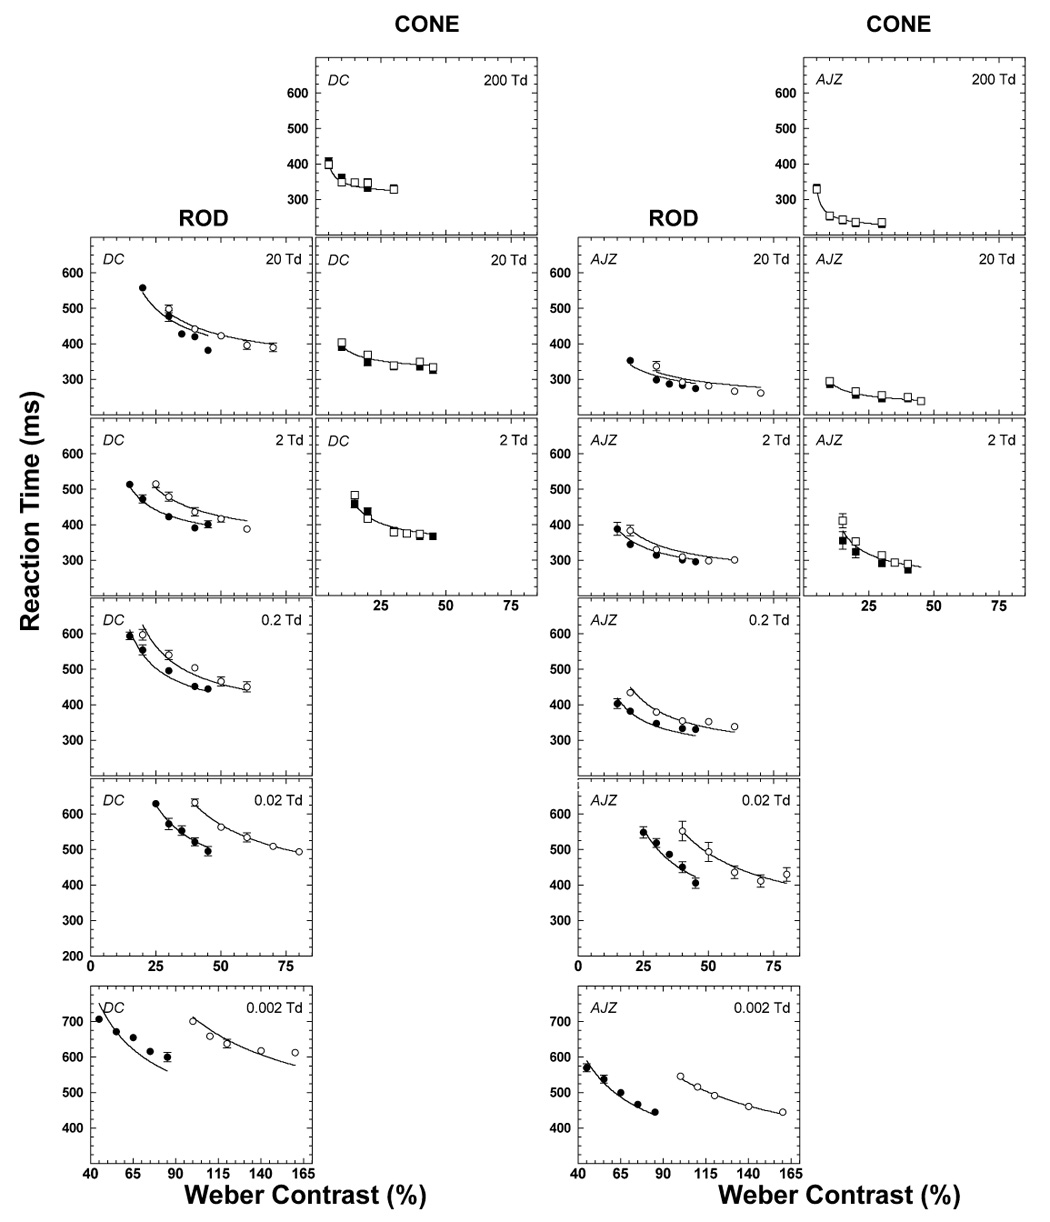
Figure 2.

The measured reaction times with rod (circles) and cone (squares) stimuli for DC (the left two columns) and AJZ (the right two columns). Each panel shows the function of the reaction time with the increment (open symbols) or decrement (solid symbols) vs. contrast at the retinal illuminance level as labeled. The solid lines are fits of the model described in Part 2.
