
Figure 4.
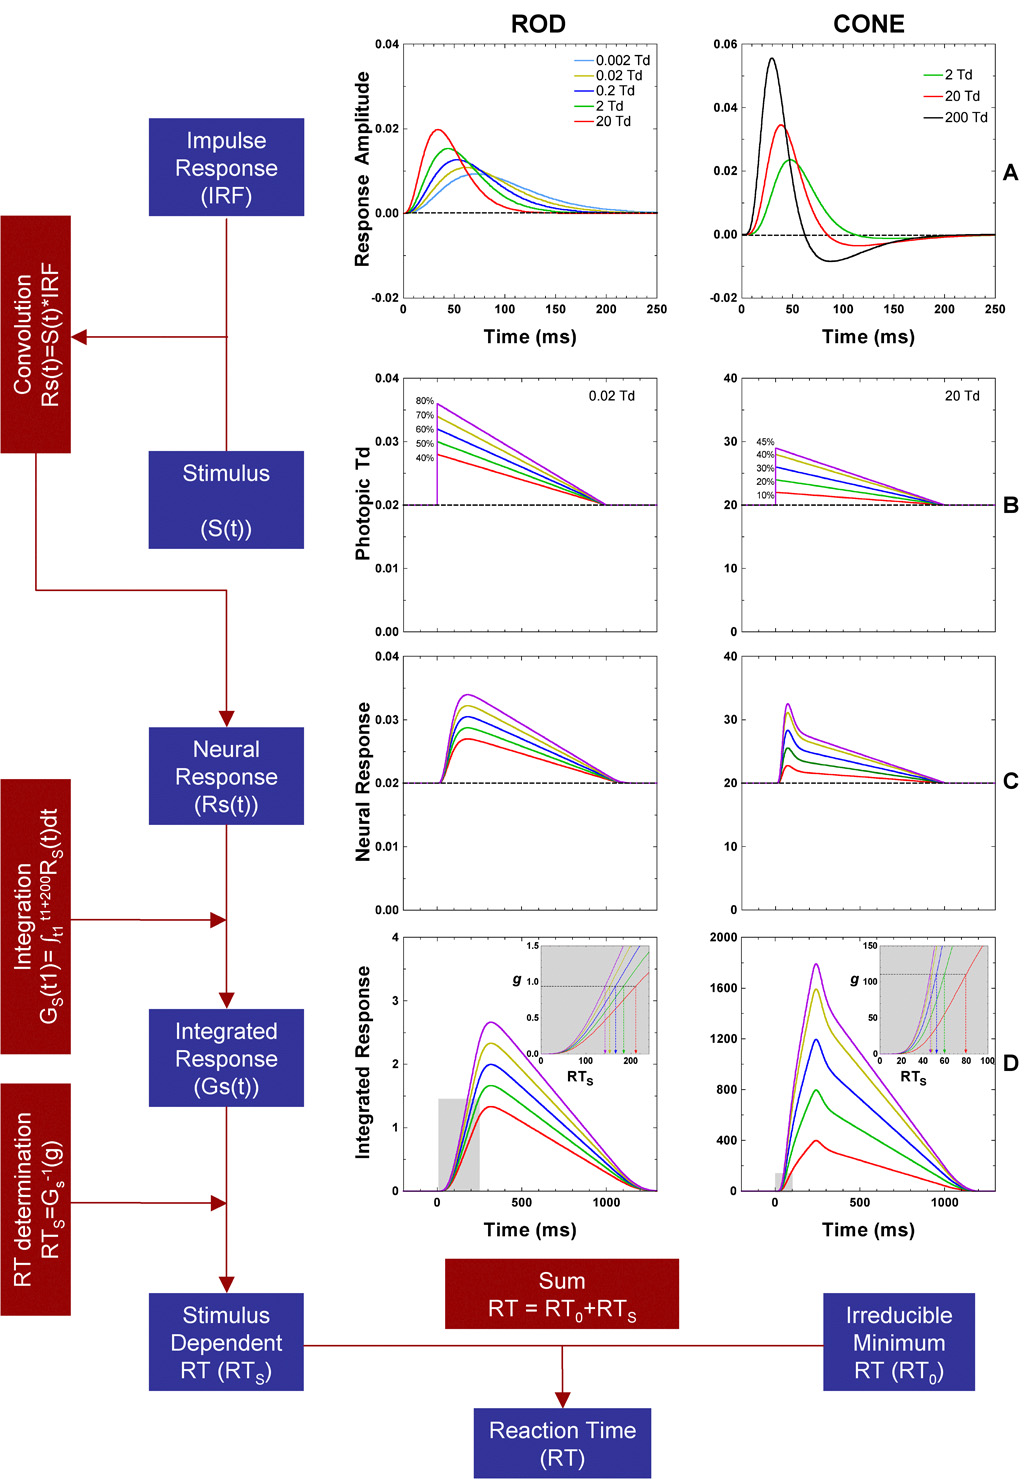
The flow chart and schematic representation of the computational model for rod (left column) and cone (right column) reaction time. A) Rod and cone impulse response functions for the retinal illuminance levels. B) Incremental stimuli at five contrasts, at 0.02 Td for rods, and 20 Td for cones. C) Convolution of the stimuli with the impulse response functions. D) Integrated neural response used for reaction time determination, based on a time point at which the integrated difference just reaches a critical value (g).