Figure 4.
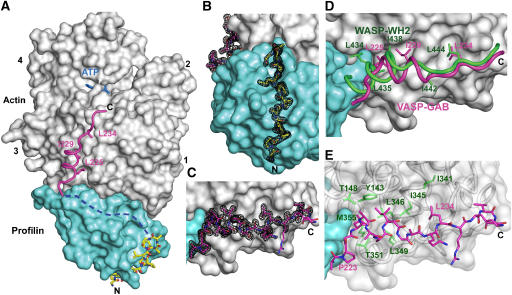
Crystal structure at 1.5-Å resolution of the ternary complex of profilin–actin with the loading poly-Pro-GAB region of human VASP. (A) General view of the structure (actin, gray; profilin, cyan). The two portions of the peptide visualized in the electron density map are colored differently (corresponding to the colors used in Figures 1 and 3): poly-Pro, all-atom representation with carbon atoms in yellow and GAB in magenta. The linker between these two sites is missing in the structure (represented by a discontinuous blue line), but can be modeled along the proposed path (see also Supplementary Movie 6). (B, C) Electron density map contoured at 1.0σ around the poly-Pro and GAB, respectively. (D) Superimpositions of the structures of the GAB of VASP (magenta) and the WH2 of WASP (green) (Chereau et al, 2005). Only the side chains of hydrophobic amino acids that interact with actin are shown. Note that the helix of the GAB is both shifted forward and rotated ∼45° relative to that of WH2, which is at least in part due to the presence of profilin in the current structure. The LKKT portions of the two structures, however, superimpose well. (E) Illustration of the main interactions of the GAB (magenta) with hydrophobic amino acids (green) of the cleft between actin subdomains 1 and 3.

