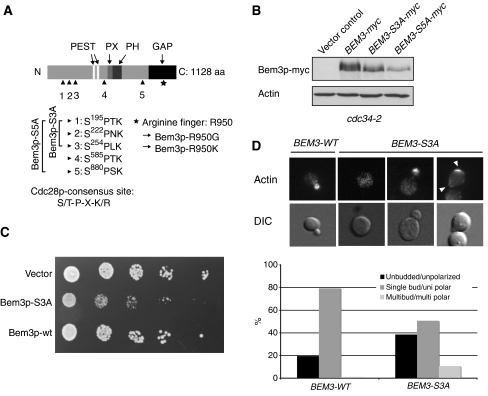
Figure 6.
Bem3p is phosphorylated at multiple sites, which are required to inhibit its activity in vivo. (A) A schematic representation of the domain structure of Bem3p; two PEST motifs (white, aa: 359–385 and aa: 430–451), the phox homology (PX) domain (light gray, aa: 608–621), the pleckstrin homology (PH) domain (dark gray, aa: 633–739) and the GAP domain (black, aa: 927–1097) are highlighted. The arrowheads mark the phosphorylated serine residues, which are mutated in the indicated Bem3p phosphomutants. Serine 585 was not found in the MS analysis, but fulfils the stringent criteria of the consensus sequence established for CDK phosphorylation (S/T-P-X-K/R) and was thus included in the functional analysis (Bem3p-S5A). The asterisks mark the catalytic arginine (R950) located in the GAP domain of Bem3p. (B) The phosphorylation pattern of Bem3p-myc (pMG220), Bem3p-S3A-myc (pMK51) and Bem3p-S5A-myc (pMK81) was analyzed by immunoblotting of cell extracts prepared from cdc34-2 (yMT670) cells shifted for 3 h to the restrictive temperature (37°C). Actin served as control for equal loading. (C) Five-fold serial dilutions of an equal number of wild-type (K699) cells transformed with an empty control plasmid (vector, pRS416) or plasmids expressing wild-type (pMG220) or the phosphorylation-deficient Bem3p-S3A mutant (pMK51) from the endogenous promoter. The plates were photographed after 3 days at 30°C. (D) Exponentially growing wild-type (K699) cells expressing wild-type Bem3p (pMG220) or Bem3p-S3A (pMK51) from the endogenous promoter were grown to log phase at 30°C. Actin was stained with rhodamine-labeled phalloidin (actin, top row), while DIC microscopy (lower row) shows the morphology of the analyzed cells. Arrowheads mark the localization of polarized actin. The number of cells with an unbudded/unpolarized (black bar), single bud/polarized (dark gray bar) and multibudded/multipolarized (gray bar) morphology were quantified and shown as the percentage (%) of the total cells analyzed; at least 200 cells were counted for each time point.

