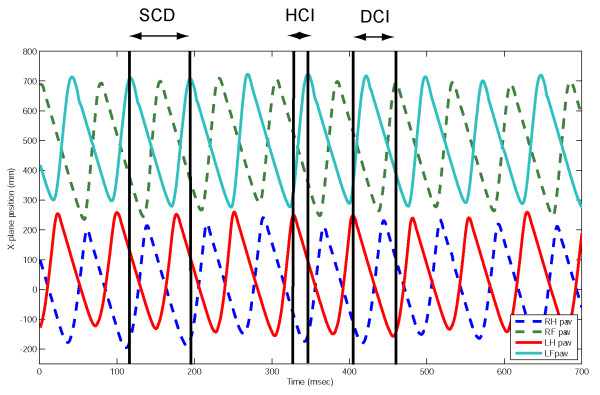
Figure 1.
QTM plot illustrating sine wave-like movement of fore and hind paws in the x-plane during treadmill walking in a normal dog. SCD indicates the step cycle duration, measured between consecutive treadmill contact by the left forelimb paw; HCI indicates the left homolateral coupling interval, measured between consecutive contact between the left hindlimb and left forelimb paws; DCI indicates diagonal coupling interval, measured between treadmill contact made by the left hindlimb paw and the right forelimb paw.

