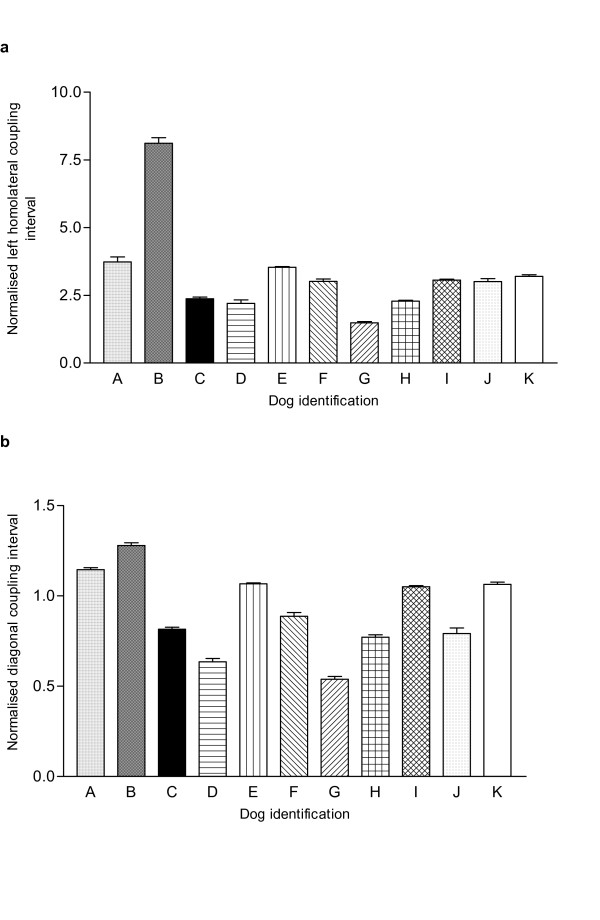
Figure 2.
Histograms illustrating the variability in normalised (a) left homolateral and (b) diagonal (left hind-right fore) coupling intervals between normal individuals. One-way ANOVA confirms a significant difference amongst the individuals [for lateral coupling: F(10,681) = 267.7; p < 0.0001; for diagonal coupling: F(10,684) = 198.9; p < 0.0001). Tukey's post hoc tests confirmed significant difference in this parameter between many specific pairs of dogs.

