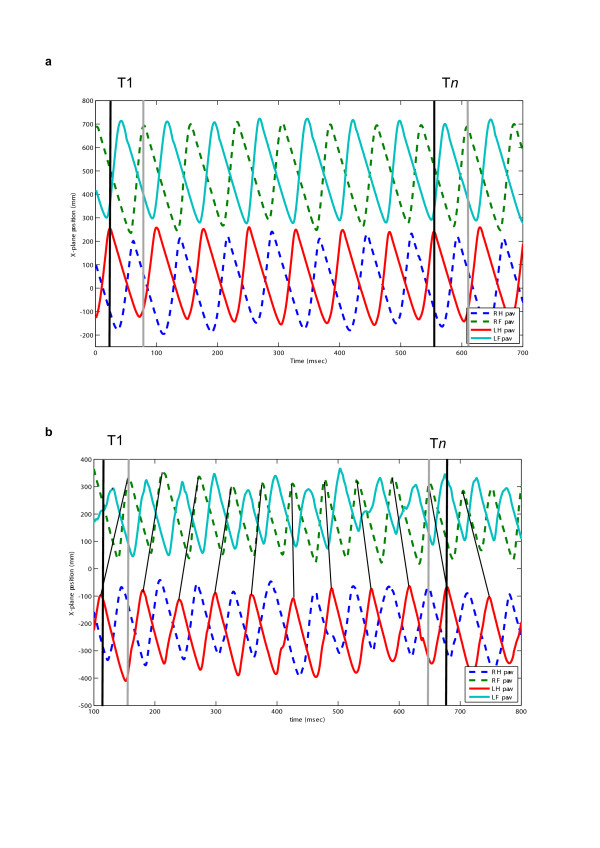
Figure 3.
QTM plot to illustrate the calculation of the mean diagonal coupling interval. T1 illustrates the interval between left hindlimb and right forelimb paw touching the treadmill at the beginning of the recorded sequence and Tn illustrates the interval between the same limb pair at the end of this (short) sequence. a: in a normal dog there is ~0 time difference between T1 and Tn. b: in a SCI dog there is a large change between T1 and Tn – note that the hindlimb paw movement is considerably delayed. The lines between forelimb and hindlimb plots indicate sequential diagonal pairs and highlight the change in temporal sequence during the recording period, which in this instance is sufficient to alter the sequence of hind and fore paw contact within the period of this recording. The mean diagonal coupling interval is derived by dividing the total difference between T1 and Tn in a sequence by the number of steps (see Methods).

