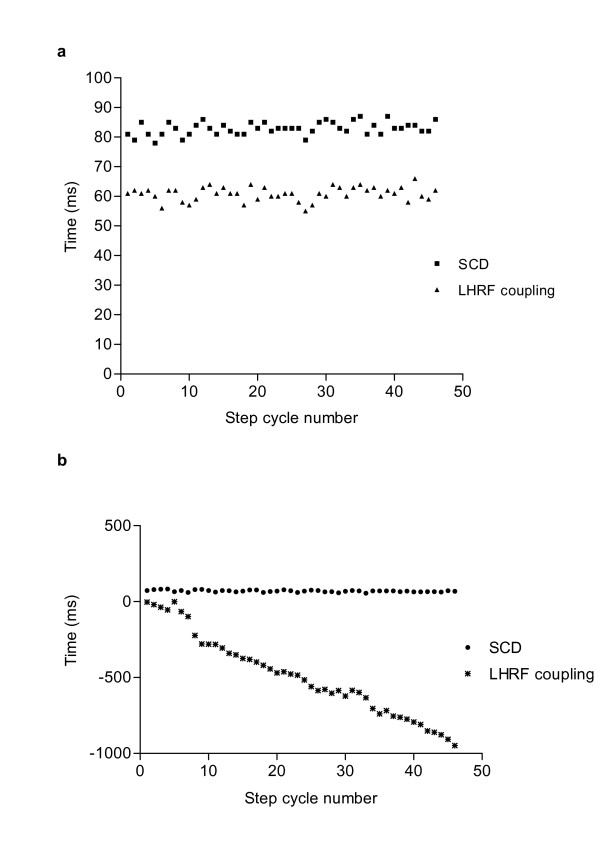
Figure 5.
Representative plots of mean diagonal coupling interval in (a) a normal dog and (b) a SCI dog – note differences in y-axis scale. In the normal dog, although there is some variability in both step cycle duration (SCD) and diagonal coupling (LHRF) there is minimal change in this interval between step 1 and step 41. In contrast, in the SCI dog the interval is greatly prolonged, reaching ~800 ms during the same period of 40 step cycles.

