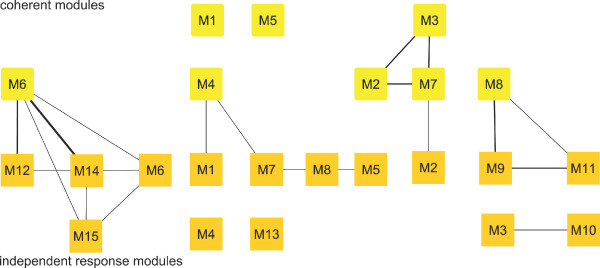
Figure 3.
Overview of the Homo sapiens multiple sclerosis modules. Depicts the independent response and coherent modules. The edges indicate the amount of overlap between the modules (equation 14), if the respective value is lower than 0.15 no line is drawn. Table 1 provides an overview of all different module types.

