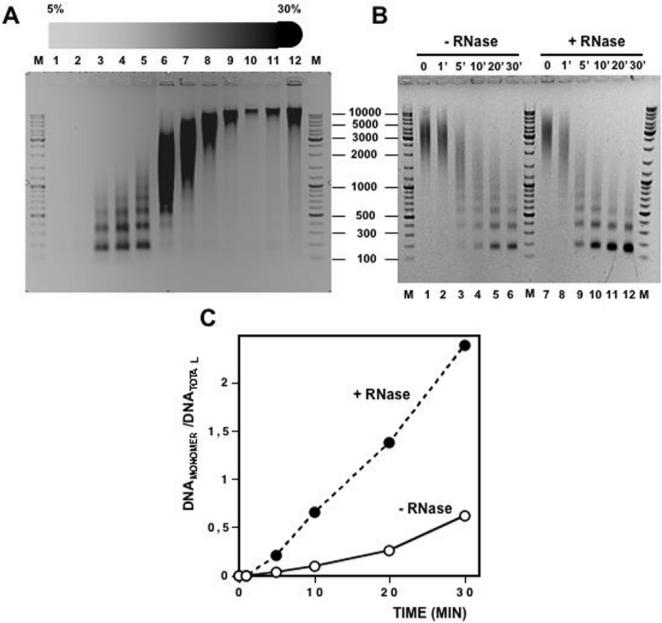
Figure 7. Treatment with RNase A increases the sensitivity of chicken liver chromatin to cleavage by micrococcal nuclease.
A) Preparative 5%–30% linear sucrose gradient of chicken liver chromatin. Fraction numbers are indicated. Lanes M, correspond to molecular weight markers. B) Fraction 8 of the gradient shown in A) was treated with RNase A (lanes 7–12) or not (lanes 1–6) and, then, digested at 37°C with 0.4 units of micrococcal nuclease (Sigma) at increasing times as indicated. After micrococcal nuclease digestion, samples were deproteinized and analyzed by electrophoresis in 1% agarose-TBE gels. Lanes M correspond to molecular weight markers. C) Quantitation of the results shown in B). The ratio of mononucleosomal DNA versus total DNA is presented as a function of the digestion time for untreated chromatin (°) and chromatin treated with RNase A (•).

