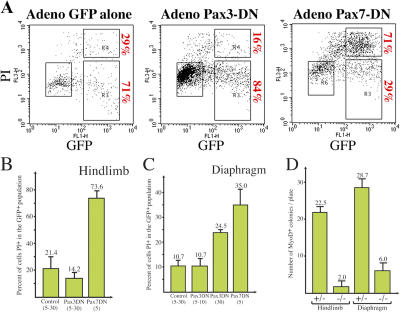
Figure 7.
The role of Pax7 and -3 in the survival of satellite cells. (A) An example of the data obtained by flow cytometry after infection of cells cultured from hindlimb muscles with a GFP-labeled adenovirus expressing GFP alone or with a dominant-negative form of Pax3 (Pax3DN) or Pax7 (Pax7DN). The percentages indicate the number of GFP-positive cells that are undergoing cell death on the basis of PI uptake (R4) compared with those that survive (R3). (B) A summary of results obtained from the hindlimb on infection with both Pax7DN and Pax3DN, based on four independent experiments with triplicate cultures in each experiment. The numbers shown in the histograms are the percentage of dying cells (R4). Control experiments were performed with adenoviruses expressing only GFP. Numbers in brackets indicate the multiplicity of infection. (C) A summary of results obtained for cells isolated from the diaphragm. The histograms correspond to five independent experiments for the control (5–30) and Pax3DN (5–10), two for Pax3DN (30), and three for Pax7DN (5). Numbers in brackets indicate the multiplicity of infection. (D) The number of MyoD-positive colonies per culture dish obtained after plating the same number of cells from hindlimb or diaphragm muscle of Pax7 LacZ/+ or Pax7 LacZ/LacZ mice at P4.

