Figure 8.
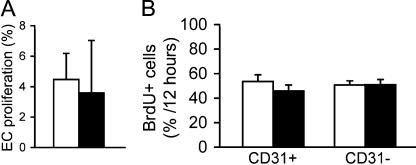
Insignificant decrease in proliferation in FAK-deficient ECs. (A) EC proliferation in P-Sp explants as measured by time-lapse microscopy. (B) EC proliferation measured by in vivo BrdU labeling. Each bar represents the mean ± SEM (error bars) of 100 cells in three independent experiments. Control, white bars; mutant, black bars.

