Figure 1.
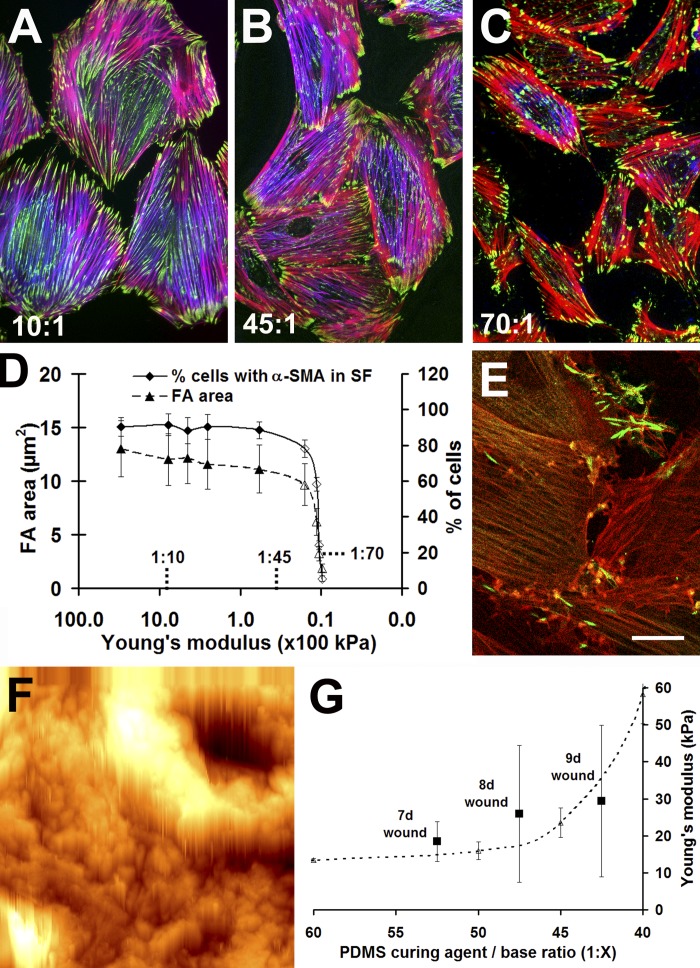
Matrix compliance controls FA size and α-SMA localization. REF-52 myofibroblasts were cultured for 12 h on PDMS substrates with a Young's modulus of 780 (A), 23 (B), and 9.6 kPa (C and E) and stained for vinculin (A–C, green), α-SMA (A–C, blue), and F-actin (phalloidin; A–C, red) after standard fixation. Numbers indicate PDMS base/curing agent ratio. (D) From such images, all FAs in the field were analyzed with a segmentation algorithm and FA size was plotted as a function of substrate compliance. The number of cells with clear α-SMA–positive stress fibers (SF) was manually assessed and related to the total number of cells. 10 cells were analyzed per substrate, and the experiment was performed three times (nFAs/substrate ∼3,000). Mean values (±SD) that differ significantly from control on plastic (P ≤ 0.001) are open symbols. Culture plastic is arbitrarily set to 3,000 kPa. (E) By using a detergent-free staining protocol, cytosolic α-SMA (green) was shown to disappear from β-cytoplasmic actin–positive stress fibers on 9.6 kPa substrates (red) and to accumulate in rods. (F) A force indentation profile was produced by AFM on a 100 × 100-μm area of a section of 9-d-old granulation tissue. Lumen and wall of a small vessel, surrounded by fibroblast-populated tissue, are obvious in the upper righthand corner. Bars: (A–C) 50 μm; (E and F) 20 μm. (G) The mean elastic modulus of 7–9-d-old granulation tissue (squares) is related to that of 1:40 to 1:60 PDMS (dotted line), both assessed with AFM.

