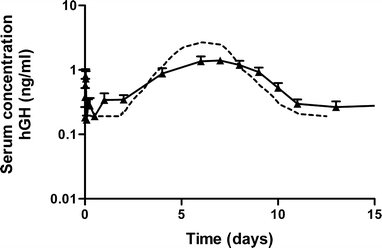
Fig. 8.

Measured hGH concentration in serum of human volunteers after administration of CTM microspheres, (closed triangles) and hGH concentration in serum (dotted line) calculated from the in vitro release of hGH using the model as described in the materials and methods. Mean ± S.E. (n = 10).
