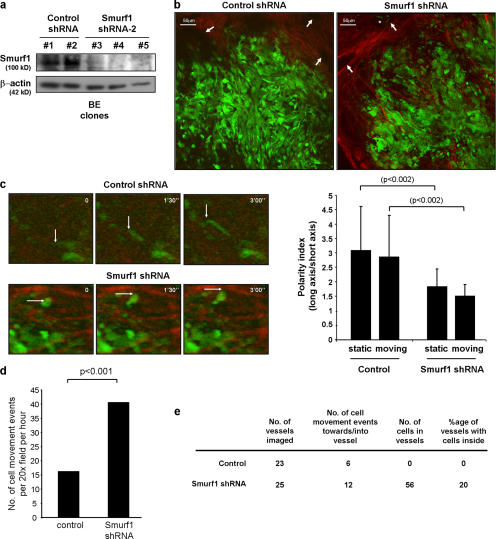
Figure 5.
Smurf1 silencing induces the mesenchymal–amoeboid transition in vivo and increases invasion and intravasation. (a) Cell extracts from independent BE clones stably expressing GFP and the control or Smurf1 shRNAs were immunoblotted for the indicated proteins. (b) Control and Smurf1-silenced BE-GFP clones were injected subcutaneously to form a tumor xenograft. Morphology of GFP-expressing tumor cells was analyzed in vivo using multiphoton intravital microscopy. Tumor cells are shown in green, and collagen fibers of the tumor stroma are shown in red. Arrows indicate tumor vessels; asterisk shows tumor cells in vessels. (c) Movement of tumor cells was imaged over time in vivo using multiphoton intravital microscopy (Videos 1 and 2). 90-s separated frames are shown (left). Movement of one individual tumor cell is indicated by an arrow. Polarity index (as an evaluation of the mesenchymal or amoeboid morphology) of static and moving tumor cells within the tumor is shown on the right. P values of t tests are indicated. (d) Cell motility was evaluated quantitatively by measuring the mean number of moving cells per microscope field in the control or Smurf1-silenced tumors. (e) The presence of tumor cells in vessels was imaged and quantified using intravital multiphoton microscopy (Video 3 and 4). Data are derived from analysis of 14 control BE tumor videos and 18 BE Smurf1 shRNA videos. Videos 1–4 are available at http://www.jcb.org/cgi/content/full/jcb.200605135/DC1.

