Figure 6.
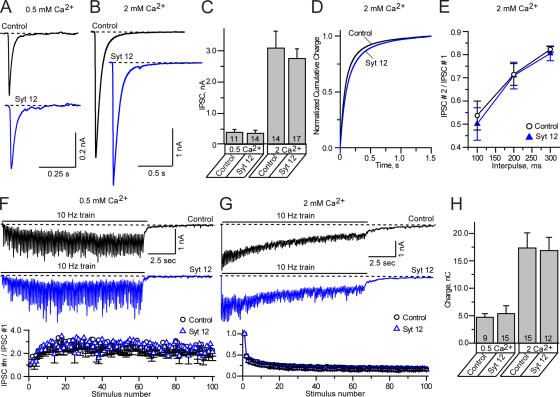
Analysis of evoked IPSCs in neurons expressing synaptotagmin-12. Primary cortical neurons isolated from newborn pups were infected with lentivirus expressing wild-type synaptotagmin-12 and analyzed at 14–17. DIV Noninfected neurons or neurons infected with GFP-lentivirus were used as a control. Inhibitory synaptic responses were evoked by local extracellular stimulation and recorded in a whole-cell mode. AMPA and NMDA currents were suppressed by the addition of CNQX and APV to the extracellular bath solution. Recordings were performed in 0.5 or 2 mM extracellular Ca2+. The holding potential was –70 mV. The data are shown as the mean ± the SEM. (A–D) Amplitudes and the time course of individual IPSCs recorded form control neurons (shown in black) or neurons infected with synaptotagmin-12 lentivirus (shown in blue). IPSCs were triggered by single-action potentials applied at low frequency (0.1 Hz). (A and B) IPSCs recorded in 0.5 (A) or 2 mM (B) extracellular calcium from the neurons cultured for 14–16 DIV. The scale bars apply to all traces. (C) Mean amplitudes of IPSCs monitored in indicated concentrations of extracellular calcium from three different cortical cultures. The total numbers of analyzed neurons are shown on each column. (D) Cumulative histograms illustrate the time course of total charge transferred over 1.5 s after single-action potential stimulation. (E) Paired pulse IPSC ratios measured in 2 mM extracellular calcium in control neurons and neurons infected with synaptotagmin-12 lentivirus. IPSCs were triggered by two action potentials spaced by various interpulse periods, as indicated on the plot. Control, n = 10; Syt 12, n = 11. (F and G) Typical inhibitory responses recorded in 0.5 (F) or 2 mM (G) extracellular calcium from control (current traces on the top, shown in black) or synaptotagmin-12–infected neurons (current traces on the bottom, shown in blue) triggered by 100 action potentials applied at 10 Hz. The scale bars apply to all traces. The plots on the bottom show the average amplitudes of synchronous IPSCs during stimulus trains. (H) Average total charges transferred during trains of 100 action potentials applied at 10 Hz. The total numbers of analyzed neurons are shown on each column. Data are shown as the mean ± the SEM.

