Figure 2.
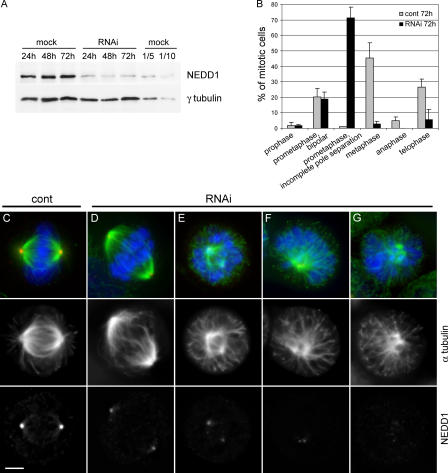
Silencing of NEDD1 induces mitotic defects. HeLa cells were treated without siRNA (mock), with control siRNA (cont), or with NEDD1 siRNA (RNAi) for various time points. (A) Immunoblot of crude cell lysates (40 μg) showing reduction of NEDD1 levels but no γ-tubulin reduction. NEDD1 levels in mock-treated cells diluted 1/5 and 1/10 are presented to compare with depleted cells. (B) Histogram indicating percentage of mitotic cells at different stages of mitosis (mean of three experiments ± SEM; 350–400 total cells scored per condition). Most of the cells are arrested in a prometaphase-like state with poorly separated spindle poles. (C–G) Mitotic cells stained for NEDD1 (red), α-tubulin (green), and DNA (blue). Bar, 5 μm.

