Figure 7.
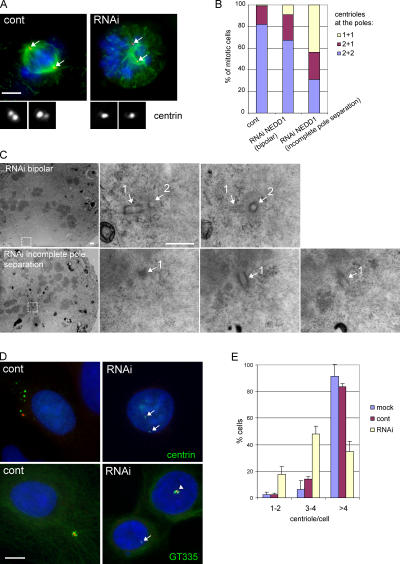
Silencing of NEDD1 inhibits centriole duplication. (A) HeLa cells stained for α-tubulin (green), DNA (blue), and centrin as a marker of the centrioles (red and insets). Cells that were efficiently depleted of NEDD1 (RNAi) show poorly separated poles, containing only one centriole at each pole. Arrows indicate positions of the centrosomes. Bar, 5 μm. (B) Quantification of the number of centrin-stained centrioles per pole (mean of three experiments; 228 control RNA-treated cells, 138 NEDD1-depleted cells with fully separated poles, and 322 depleted cells with incompletely separated poles were scored). (C) Electron microscopy of a cell with a bipolar mitotic spindle (RNAi bipolar) and a depleted cell with a monopolar phenotype (RNAi incomplete pole separation). The pictures on the left show low magnifications, and selected areas at high magnifications are at the right. Serial sections of spindle poles reveal a pair of closely associated centrioles (1 and 2) oriented at a 90° angle in the bipolar spindle, whereas only a single centriole (1) could be found at the pole of the depleted cell. Bar, 500 nm. (D) U2OS cells treated with aphidicolin and stained for NEDD1 (red), DNA (blue), and centrin or polyglutamylated tubulin (GT335; green). Control cells or poorly depleted cells (arrowhead in bottom right image) show clouds of numerous centriole dots, whereas efficiently depleted cells have mainly 1–4 centrioles (arrows). Bar, 10 μm. (E) Quantification of centriole numbers per cell was based on centrin staining. Numbers were obtained from selected cells that displayed a strong reduction of NEDD1 levels (mean of three experiments ± SEM; 350–400 cells scored per condition).

