Figure 2.
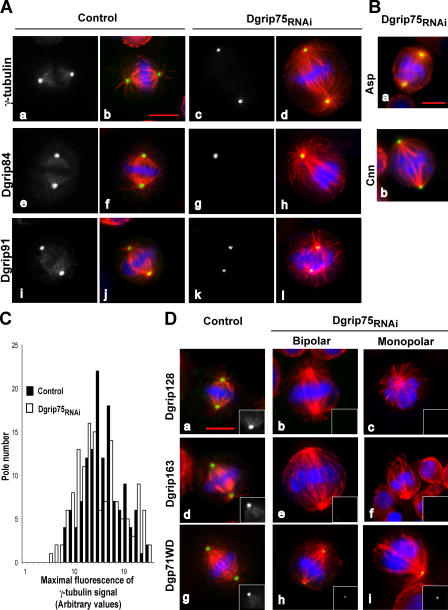
Immunofluorescence analysis of phenotypes induced by Dgrip75 depletion in S2 cells. (A) Localization of γ-TuSC components in mitotic cells. Control or Dgrip75-treated cells (Dgrip75RNAi) were analyzed by staining with antibodies against γ-tubulin (a and c), Dgrip84 (e and g), and Dgrip91 (i and k). Merge (b, d, f, h, j, and l): blue, chromosomes; red, microtubules; green, γ-TuSC components. (B) Spindle pole focusing and localization of centrosomal markers. Dgrip75-depleted cells were stained with antibodies against Asp (a, green) or Cnn (b, green). Red, α-tubulin; blue, chromosomes. (C) Quantification of polar γ-tubulin by immunofluorescence. The maximal signal obtained after γ-tubulin staining was scored on each pole of bipolar spindles for control (closed bars) and Dgrip75-depleted cells (open bars). Correlations of 0.73 (n = 67; P95 = 0.62–0.84) and 0.72 (n = 69; P95 = 0.61–0.83), respectively, were observed between the maximal fluorescence measured at the two poles of control or treated cells. (D) Localization of γ-TuRC–specific components (Dgrip128, Dgrip163, and Dgp71WD) in mitotic cells. Blue, chromosomes; red, microtubules; green, γ-TuRC–specific components. Insets represent a hemispindle stained with antibodies against Dgrip128, Dgrip163, and Dgp71WD. For A and D, a quantitative view is shown in Table I. Bars, 5 μm.

