Figure 5.
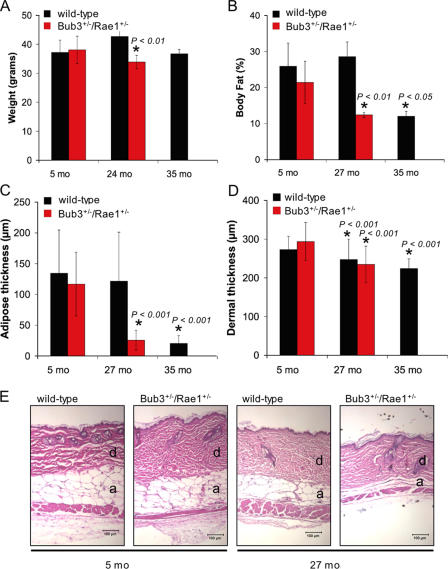
Early aging–related phenotypes of combined Bub3/Rae1 haploinsufficient mice. (A) Body weight analysis of wild-type and Bub3+/−/Rae1+/− male mice (n ≥ 4 male mice per genotype). Bub3+/−/Rae1+/− mice have normal body weights at 5 mo but significantly reduced body weights at 24 mo. We note that neither Bub3+/− nor Rae1+/− mice show this reduction (not depicted). The decrease in body weight between the 24- and 35-mo-old wild-type mice is not significant but does show a trend of reduction in body weight. (B) Graph showing total body fat content in wild-type and Bub3+/−/Rae1+/− mice at 5, 27, and 35 mo (n = 4 male mice per genotype at each age). (C) Graph showing subcutaneous adipose layer thickness of wild-type and Bub3+/−/Rae1+/− mice at 5 and 27 mo along with 35-mo-old wild-type mice. Note the reduced thickness in 27-mo-old Bub3+/−/Rae1+/− mice and 35-mo-old wild-type mice (n = 4 males per genotype). (D) Graph showing dermal thickness of wild-type and Bub3+/−/Rae1+/− mice at 5 and 27 mo along with 35-mo-old wild-type mice. (A–D) Error bars represent SD. Asterisks mark values that are significantly different from wild-type values using a Mann-Whitney test. (E) Representative hematoxylin and eosin–stained dorsal skin sections of 5- and 27-mo-old wild-type and Bub3+/−/Rae1+/− from which the data in C and D were collected. Dermis (d) and adipose layer (a) are indicated. Bars, 100 μm.

