Figure 6.
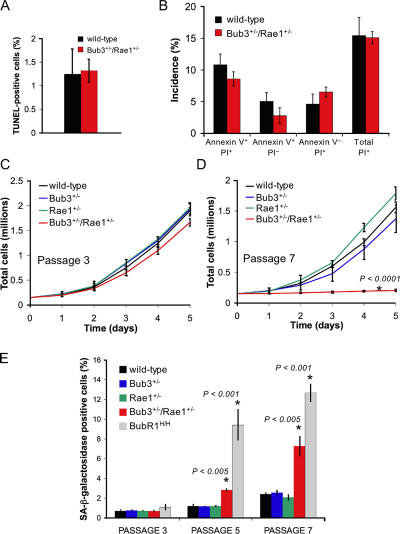
Early onset of cellular senescence in Bub3/Rae1 double haploinsufficient MEFs. (A) Analysis of the percentages of cell death in Bub3+/−/Rae1+/− and wild-type MEFs cultures by TUNEL assay (n = 3 MEF lines per genotype). (B) Percentages of Bub3+/−/Rae1+/− and wild-type MEFs that are in the early stages of apoptosis (annexin V+/PI− cells), in the late stages of apoptosis, already dead (annexin V+/PI+ cells), that undergo nonapoptotic cell death (annexin V−/PI+ cells), or that are dead (PI+ cells). We used 3 MEF lines per genotype. We note that the differences between Bub3+/−/Rae1+/− and wild-type MEFs were not statistically significant using an unpaired t test. (C and D) Growth curves of wild-type, Bub3+/−, Rae1+/−, and Bub3+/−/Rae1+/− MEF cells at P3 (C) and P7 (D). 1.5 × 10⁵ cells of indicated passages were seeded in duplicate on day 0 and counted for five consecutive days. Lines represent three independent MEF lines. Note that Bub3+/−/Rae1+/− MEF cells have reduced proliferation potential at P7, whereas single heterozygous Bub3+/− and Rae1+/− MEFs do not. (E) Percentages of wild-type, Bub3+/−, Rae1+/−, BubR1H/H, and Bub3+/−/Rae1+/− MEF cells that were positive for SA β-galactosidase activity at the indicated passages (n = 3 lines for each genotype at each passage). Asterisks in D and E mark values that are significantly different from those of wild-type mice using an unpaired t test. Error bars represent SD.

