
Figure 5.
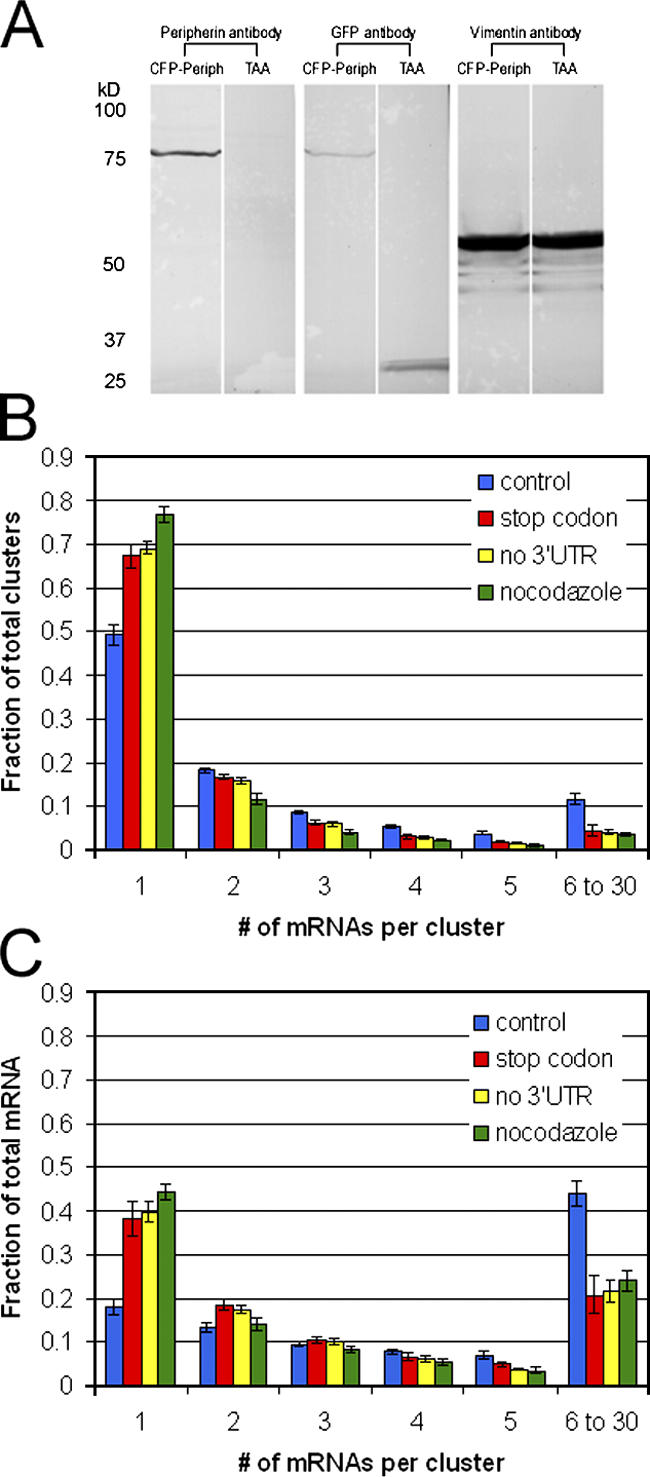
Insights into peripherin mRNA clustering. The relative roles of the nascent peripherin protein chain, the 3′UTR of peripherin mRNA, and MT in the formation of peripherin mRNA clusters were studied. (A) To determine the role of the nascent peripherin protein in mRNA clustering, a peripherin translation-null construct (ECFP-TAA-peripherin-R24-3′UTR) was created by inserting a stop codon (TAA) between the CFP and peripherin CDSs in the ECFP-peripherin-R24-3′UTR construct. To confirm the effectiveness of the inserted stop codon in preventing the translation of peripherin, Rat2 cells that are null for peripherin were transfected with either the ECFP-peripherin-R24-3′UTR construct as a control or the ECFP-TAA-peripherin-R24-3′UTR construct. After 24 h, whole cell lysates of these transfected Rat2 cells were separated by SDS-PAGE, transferred to nitrocellulose, and immuno-blotted with antibodies against CFP (GFP antibody) and peripherin. Vimentin, the endogenous Rat2 IF protein was used as a loading control. In cells expressing the control plasmid (CFP-Periph), both the peripherin and GFP antibodies recognized a product with a molecular weight of ∼81 kD, the predicted size of the CFP-peripherin fusion protein. In cells expressing the construct with the TAA insertion, there was no detectable peripherin by immunoblotting, and the GFP antibody recognized an ∼27-kD product, the predicted size of CFP. (B) A histogram comparing the distributions of peripherin mRNP clusters in control cells (blue bars, ECFP-peripherin-R24-3′UTR), ECFP-TAA-peripherin-R24-3′UTR–transfected cells (red bars), cells expressing the 3′UTR-null construct (yellow bars, ECFP-peripherin-R24), and control cells (ECFP-peripherin-R24-3′UTR) treated with nocodazole during NGF-induced differentiation (green bars). PC12 cells were transfected with the various constructs for 24 h, followed by NGF for 4 h. The cells were prepared for FISH and quantitatively analyzed as described in Fig. 4. Error bars depict the SEM. (C) A histogram comparing the distributions of total peripherin mRNA in control cells (blue bars, ECFP-peripherin-R24-3′UTR); ECFP-TAA-peripherin-R24-3′UTR transfected cells (red bars); cells expressing the 3′UTR-null ECFP-peripherin-R24 construct (yellow bars); and control cells (ECFP-peripherin-R24-3′UTR) treated with nocodazole.