Figure 2.
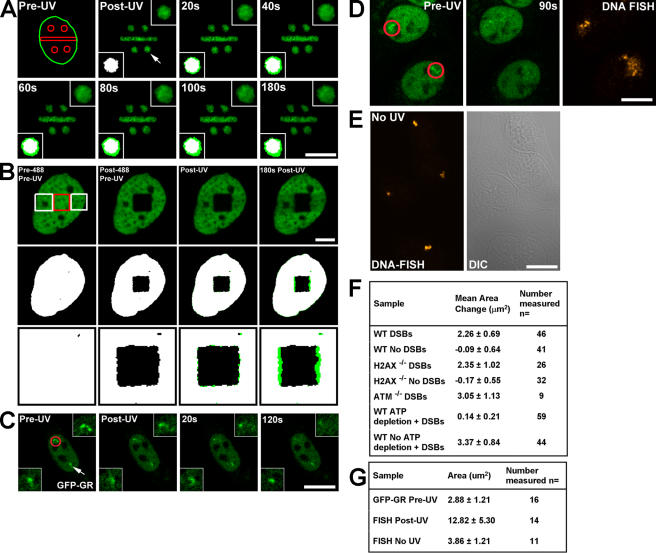
Local expansion in chromatin structure upon the introduction of DSBs. (A) Specific subnuclear regions were photoactivated, and DSBs were introduced in H2AX−/− cells by UV laser microirradiation. A nucleus with four circular and one rectangular region is shown with the arrow in the post-UV image, denoting the zoomed circular region presented in the top right and bottom left corner insets. Binary maps for each time point were generated, and the map for the post-UV image (set as white) was superimposed onto the maps (set as green) for each subsequent time point (bottom left inset). The pre-UV image shows the outline of the nucleus in green and the prephotoactivated and DSB-containing regions in red. Bar, 15 μm. (B) H2AX−/− MEFs expressing H3-GFP were incubated with Hoechst dye, and a subregion of the GFP signal was photobleached using the 488-nm laser (red square, left). Subsequently, two flanking regions were exposed to UV laser microirradiation (two white squares, left), and the cell was followed for 180 s after UV laser microirradiation (right). Binary maps for the GFP signal above background were generated and colored white for the pre-488/pre-UV and post-488/pre-UV images (shown in the second row and at higher magnification in the bottom row). Binary maps for the post-UV and 180 s post-UV images were colored green and super imposed onto the white binary map from the post-488/pre-UV image. The difference in area between the post-UV and 180 s post-UV images is shown in green relative to the white images in the bottom two rows. The chromatin regions containing DSBs expand into the nondamaged region, whereas the nondamaged regions above the photobleached GFP square do not display any expansion. Bar, 5 μm. (C) A nucleus containing two copies of the MMTV gene array and expressing GFP-GR localized to the nucleus was exposed to UV laser microirradiation in only one of the two gene arrays, shown as a red circle in the left image and in the top corner inset. The nondamaged gene array is denoted by the white arrow and in the bottom corner inset. Bar, 15 μm. (D) MMTV gene array–containing cells similar to those described in Fig. 2 C, but 90 s after exposure to UV laser microirradiation, they were fixed and DNA FISH was performed probing for the gene array, as shown in the right panel. The two cells shown have a single copy of the gene array. Red circles in the left image denote gene arrays exposed to UV laser microirradiation. Bar, 15 μm. (E) Area of nondamaged MMTV arrays and DNA FISH. Cells containing the MMTV gene array and expressing GFP-GR localized to the nucleus were sensitized by the Hoechst dye but not exposed to UV laser microirradiation. DNA FISH was performed using MMTV gene array–specific probes, and fluorescence images were collected. Bar, 10 μm. (F) Measurements of the expansion in area for photoactivated H2B-PAGFP subnuclear regions in damaged and nondamaged WT (with or without ATP depletion), H2AX−/−, and ATM−/− live cells. Measured starting area of circular regions was ∼7.08 μm2 for all samples. (G) Area occupied by MMTV gene arrays in living cells and after DNA FISH in both damaged and nondamaged gene arrays.

