Figure 3.
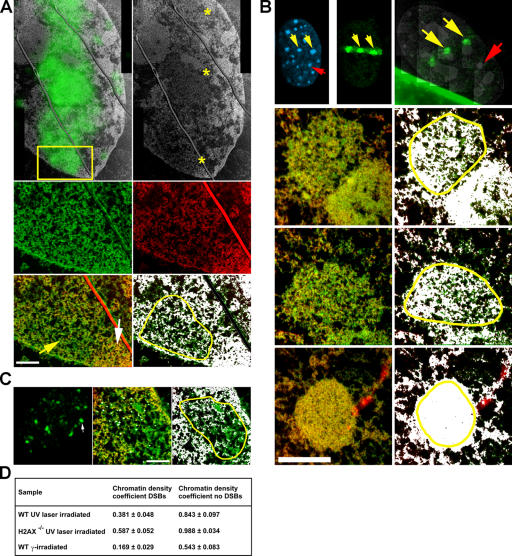
Ultrastructure of chromatin containing DSBs. (A) WT cells exposed to UV laser microirradiation and containing DSBs were labeled against γ-H2AX to mark DSBs, which is shown by green fluorescence track overlaid onto the low magnification ESI net phosphorus image in the top left panel. The ESI image is also in the top right panel with three asterisks denoting the right-most boundary of the track exposed to UV laser microirradiation (two gray lines traversing the laser track are EM sectioning artifacts). The yellow box denotes the region imaged at higher magnification by ESI in the bottom four panels. The middle row in green is the high magnification net nitrogen image map and in red is the net phosphorus image map. The bottom left panel is a net phosphorous/nitrogen overlay image, with the yellow arrow denoting the region containing DSBs and the white arrow denoting part of the heterochromatin region just adjacent to the laser-irradiated region. The bottom right panel is the same net phosphorous/nitrogen overlay image but with a threshold mask applied to highlight, on a pixel by pixel basis, the areas of the image containing a phosphorous/nitrogen ratio representative of chromatin, which is shown in white. The yellow outline denotes the region containing DSBs that was used to calculate the chromatin density coefficients. Bar, 500 nm. (B) Ultrastructure of chromatin containing DSBs in UV laser–irradiated H2AX−/− cells. (top) Fluorescence images of Hoechst-stained DNA and Nbs1 (left and middle panels, respectively) in fixed cells after UV laser microirradiation. The Nbs1 staining in green highlights the subnuclear region exposed to UV microirradiation. The right panel in the top row is a resampled fluorescence image of the same nucleus but from the ultrathin section of the embedded cells, which is overlaid onto a low magnification net phosphorous image montage of the same nucleus imaged by ESI. The yellow arrows denote two heterochromatic regions exposed to UV laser microirradiation, and the red arrow points to an equivalent region not exposed to UV laser irradiation. The following three rows show the higher magnification ESI net phosphorous/nitrogen overlay (left column) and phosphorous/nitrogen ratio threshold mask plus overlay (right column) images as described in Fig. 3 A. The bottom row displays the region not exposed to UV laser microirradiation, whereas the middle two rows display the two regions exposed to UV laser irradiation. DSBs reduce the density of chromatin fibers (white) within heterochromatin by ∼40%. The yellow outlines denote the regions used to calculate the chromatin density coefficients. Bar, 500 nm. (C) ESI images of IRIF in WT cells. The left panel shows a resampled fluorescence image map of the sectioned nucleus, subsequently imaged by ESI at high magnification. The white arrow denotes the single focus presented in the high magnification ESI net phosphorous/nitrogen overlay image (middle) and phosphorous/nitrogen ratio threshold mask plus overlay image (right) as described in Fig. 3 A. The cluster of silver-enhanced immunogold particles is shown in white in the net phosphorous/nitrogen overlay image (middle). The yellow outline denotes the IRIF area containing gold particles, which was used to calculate the IRIF chromatin density coefficient. Bar, 380 nm. (D) Quantitation of phosphorous/nitrogen chromatin density coefficients in UV and γ-irradiated samples compared with regions not exposed to irradiation (at least 10 cells were analyzed for each genotype and treatment).

