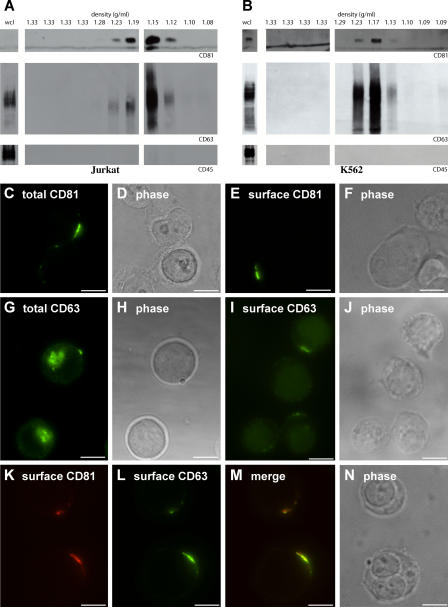
Figure 1.
Jurkat T cells sort exosomal proteins to discrete domains of the plasma membrane. (A and B) Sucrose density gradient analysis of exosomes from Jurkat T cells (A) and K562 cells (B). Densities of the different fractions are listed at the top in grams/milliliters. Note the significant enrichment of CD81 and CD63 in exosome fractions relative to the levels of the proteins in the whole cell lysate (wcl; CD81 could not be detected in the whole cell lysate sample). The same amount of whole cell lysate and gradient fractions were used for all three blots. (C–J) Jurkat T cells were processed for fluorescence microscopy using antibodies specific for CD81 (C–F) or CD63 (G–J) under permeabilizing (C, D, G, and H) or nonpermeabilizing (E, F, I, and J) conditions. Shown are fluorescence (C, E, G, and I) and phase-contrast (D, F, H, and J) images of representative cells. (K–N) Unpermeabilized Jurkat T cells were fixed and processed for fluorescence microscopy using antibodies specific for CD81 (K) and CD63 (L). (M) Merge of K and L. (N) Phase-contrast image of the cell. Bars, 10 μm.

