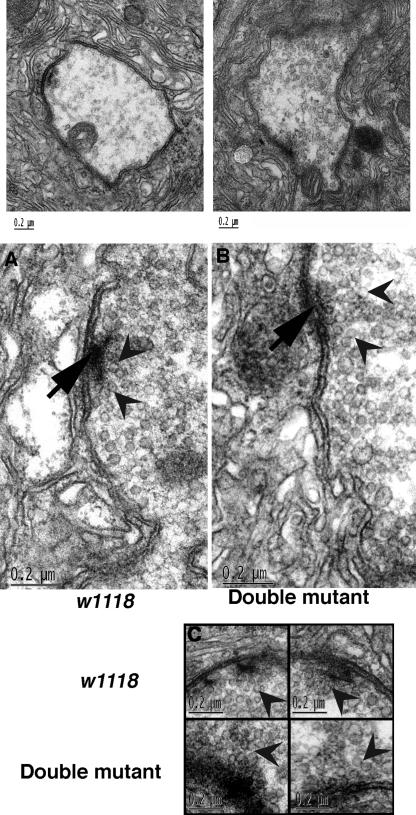
Figure 6.
Scramblase mutants have an increased number of SVs in the active zone. (top) Transmission electron micrograph of a synaptic bouton from control w1118 and the double mutant. (middle) Transmission EM comparison of the active zones from a control w1118 and the double mutant. The arrows indicate the T-bar in the active zone. Arrowheads show the vesicles clustered close to this area. (bottom) The top two figures show the active zones from w1118 type 1b synaptic boutons, and the bottom two figures are from the double mutants.

