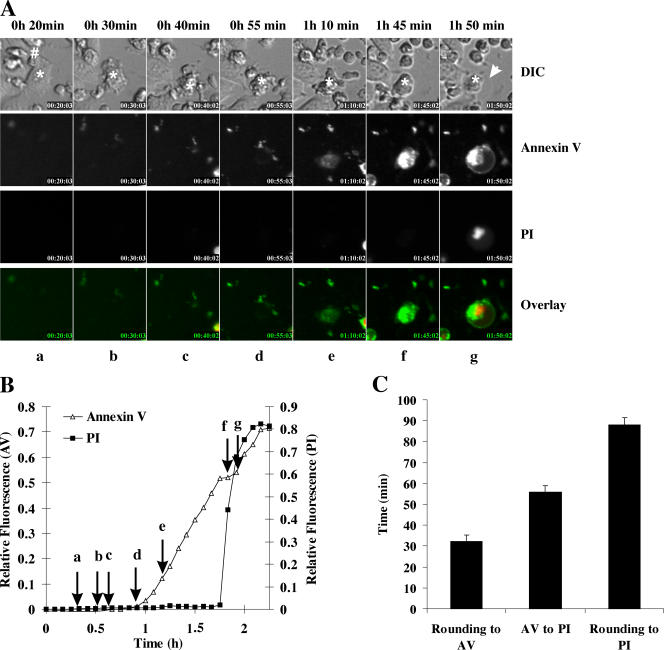
Figure 4.
Time-lapse microscopy of death induced by wild-type CTLs. CTLs isolated from wild-type mice were incubated with MS9II cells. (A) Images of morphology, annexin V binding, and PI uptake were taken sequentially every 5 min. At 20 min (a), the CTL (indicated by #) forms a synapse with the target (indicated by asterisks). By 30 min (b), the target cell is blebbing and rounding, and, by 55 min (d), the target cell is still blebbing but remains annexin V negative. By 1 h 10 min (e), the cell becomes annexin V positive but maintains plasma membrane integrity until 1 h 45 min (f). Plasma membrane integrity is lost, and the cell becomes PI positive by 1 h 50 min. The full video is presented in Video 3 (available at http://www.jcb.org/cgi/content/full/jcb.200510072/DC1. Arrow indicates the swollen plasma membrane. DIC, differential interference contrast. (B) Fluorescence of annexin V binding and PI relative to maximum fluorescence is presented for the cell depicted by the asterisk in A. The point at which frames (a–g) were recorded in A are shown on the time line by arrows. (C) The duration from rounding to annexin V binding and annexin V binding to PI uptake was calculated for individual cells and is presented as means ± SEM (error bars; n = 33).

