Figure 1.
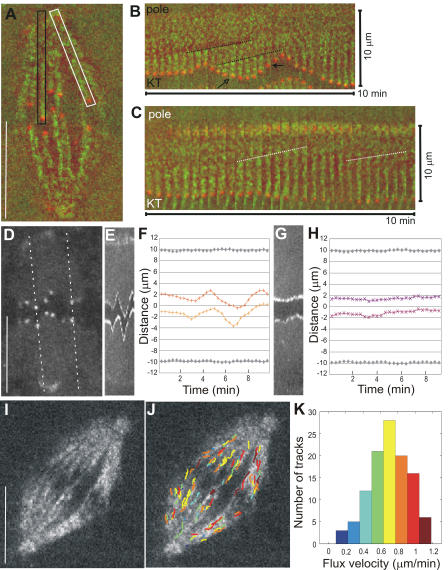
Poleward flux and relative kinetochore movements in control PtK1 cells. (A) Single frame from combined time-lapse sequence of tubulin (green) and CENP-F labeling of kinetochores and poles (red; Video 1, available at http://www.jcb.org/cgi/content/full/jcb.200601075/DC1). A fast Fourier transform filter set at high pass with a 20% cutoff in MetaMorph v4.5 was performed on the entire image sequence to help visualize fluorescent speckles above background. Black box denotes the region containing a MT kinetochore fiber, and its attached pole and kinetochore are shown in B. White box denotes the region shown in C. (B) Montage of cropped region from the interior of the spindle containing a kinetochore fiber and its attached pole and kinetochore. Each frame is 20 s apart; entire montage is 10 min from left to right. Maximum pole to kinetochore distance is 10 μm. Dotted lines follow the position of two speckles from frame to frame whose slopes indicate the rate of flux (0.6 and 0.7 μm/min, respectively). Open arrow denotes the time point at which the kinetochore is moving away from the pole and a new fluorescent speckle has incorporated into the kinetochore fiber. Closed arrow denotes the time point at which the kinetochore is moving poleward and “chewing up” a fluorescent speckle. (C) Montage of cropped region from the outer part of the spindle. Pole to kinetochore distance is 10 μm. The slopes of the dotted lines indicate a rate of speckle flux of 0.62 and 0.54 μm/min. (D) Single frame of fluorescently labeled CENP-F localized at the kinetochores and poles (same spindle as in A). Dotted lines show the location of the kymograph lines shown in E and G. (E) Kymograph of sister kinetochores in the interior of the spindle. (F and H) Kinetochore position (color) and pole position (gray) over time. (G) Kymograph of sister kinetochores at the spindle periphery. (I) Single frame of a time-lapse sequence showing a spindle imaged in FSM. (J) Frame in I overlaid with tracks of computer-detected speckle movement (color-coding according to the histogram in K). (K) Distribution of individual speckle velocities in J. Number of speckles tracked is 111; mean velocity is 0.70 ± 0.22 μm/min. Bars, 10 μm.

