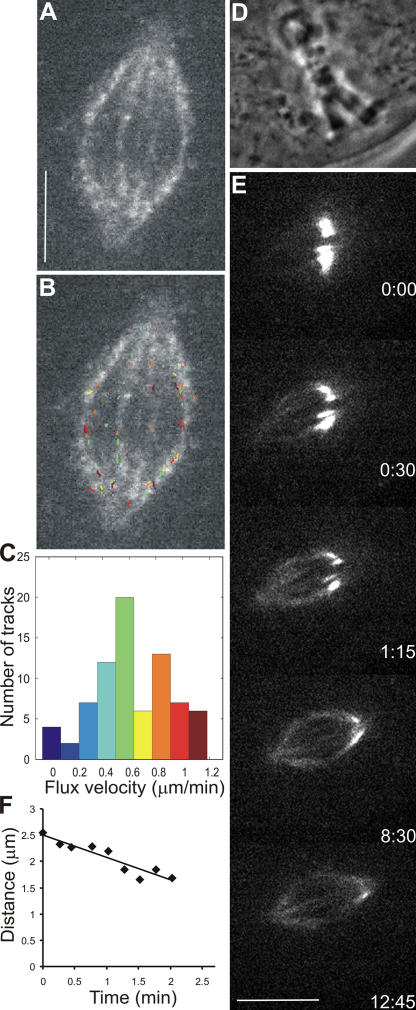
Figure 2.
Poleward flux in bipolar PtK1 cells treated with 200 μM monastrol. (A) Single frame of FSM time-lapse sequence of the spindle in a PtK1 cell treated with monastrol (Video 4, available at http://www.jcb.org/cgi/content/full/jcb.200601075/DC1). Bar, 5 μm. (B) Image in A overlaid with computer-tracked speckle trajectories (color-coding according to histogram in C). (C) Distribution of individual speckle velocities in B. Number of speckles tracked is 77; mean velocity is 0.61 ± 0.30 μm/min. (D) Phase-contrast image of a PtK1 cell expressing PA-GFP–tubulin that was treated with monastrol. (E) Time series of fluorescence images showing photoactivated fluorescent mark of GFP-tubulin (Video 5). Time in minutes/seconds is given in the bottom right corner of each image. Bar, 10 μm. (F) Distance between the distal end of mark and pole versus time. Slope indicates kMT flux rate of 0.43 μm/min.

