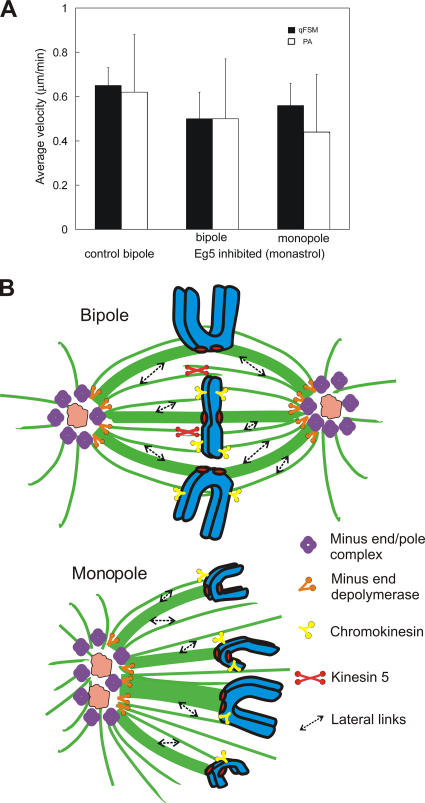
Figure 5.
Summary of flux measurements and model. (A) Bar graph comparing the flux rate in control, kinesin 5–inhibited bipoles, and monopoles using qFSM (black bars) and photoactivation (white bars). Error bars are the SD between spindles. (B) Model of spindle components contributing to poleward flux in bipolar and monopolar PtK1 cells.

