Figure 2.
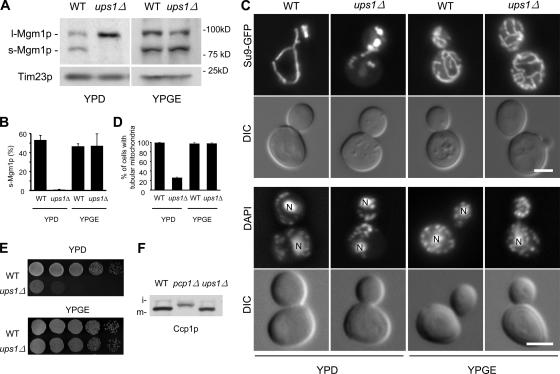
Phenotypes of ups1Δ cells. (A) Cell lysates from WT and ups1Δ cells grown in YPD or YPGE were analyzed by immnoblotting using antibodies to Mgm1p and Tim23p. (B) Mgm1p signals were quantitated by densitometry using NIH image. The percentage of s-Mgm1p was calculated from the ratio of s-Mgmp1/(s-Mgm1p + l-Mgm1p). Values are mean ± SD (n = 3). (C, top panel) Cells expressing mitochondria-targeted Su9-GFP (Westermann and Neupert, 2000) were grown in YPD or YPGE to log phase and viewed by differential interference contrast and fluorescence microscopy. (C, bottom panel) Cells were fixed in 3.7% glutaraldehyde, washed, and stained with 1 μg/ml DAPI. ‘N’ indicates nuclear DNA staining. Bars, 3 μm. (D) Quantitation of mitochondrial morphology (n = 300). (E) Serial dilutions of WT and ups1Δ cells were spotted onto YPD and YPGE and incubated at 30°C for 2 d and 4 d, respectively. (F) Lysates from cells expressing Ccp1p-HA grown in YPGalSuc were analyzed by immnoblotting using anti-HA antibodies. i: i-Ccp1p, m: m-Ccp1p.

