Figure 2.
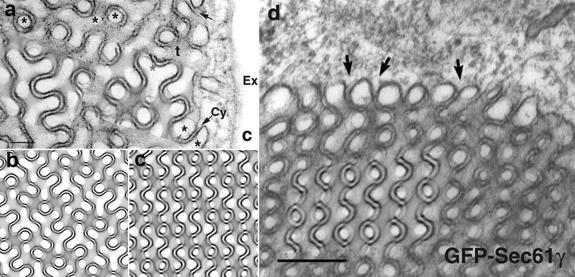
Identification of cubic membrane morphologies in TEM micrographs. Two examples of the DTC method, applied to TEM images of OSER (adopted from Snapp et al., 2003). (a) The original TEM micrograph (Snapp et al., 2003 Fig. 2 c) matches perfectly to the theoretical superimposed projections of balanced (2-parallel surfaces) gyroid cubic membranes, as depicted in b. Asterisks indicate one of the multicontinuous, yet distinct, subvolumes of cubic membrane architecture. A double diamond projection (c) matches the TEM micrograph (d) adopted from Fig. 7 b of Snapp et al., (2003). The arrows in a and d indicate the continuity of one cubic membrane subvolume (between closely arranged bilayers) and the cytoplasm (Cy). Signature patterns of the theoretical projection are indistinguishable to the electron density pattern of the TEM micrographs. The simulated projections are generated from sections with a thickness of 1/4 of a unit cell, viewed along the direction [36, 30, 17] for gyroid (b) and [28, 16, 5] for double diamond-type (c). The unit cell is the smallest structural unit that possesses the symmetry and properties of cubic membranes. Bars: (a) 100 nm; (d) 160 nm.

