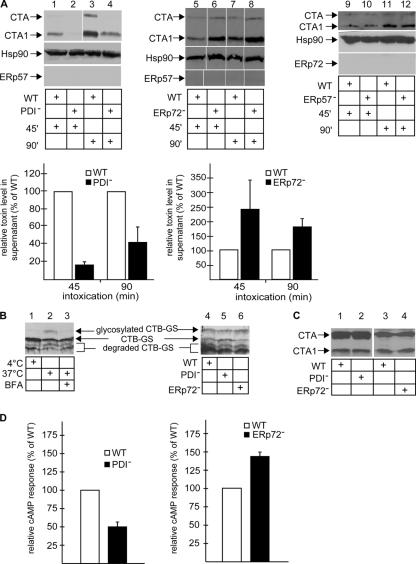
Figure 3.
PDI and ERp72 exert opposing effects on CT retrotranslocation. (A, top) Wild-type (WT), PDI−, ERp72−, and ERp57− cells were incubated with CT for 45 or 90 min, permeabilized, and the supernatant fraction was analyzed as in Fig. 1. (bottom) The intensities of the CTA and CTA1 bands in the supernatant were quantified. Graphs show the mean ± SD (error bars) of two to four experiments. (B) Wild-type, PDI−, and ERp72− cells were incubated with CT-GS, and the cell lysate was subjected to SDS-PAGE followed by immunoblotting with an anti-CTB antibody. Nonglycosylated and glycosylated CTB are 17 and 21 kD, respectively. (C) Whole cell lysates from CT-intoxicated wild-type, PDI−, and ERp72− cells were prepared in the presence of NEM and subjected to immunoblotting with CTA antibody. (D) Wild-type, PDI−, and ERp72− cells were incubated with CT for 45 or 90 min, and the cAMP level was measured by a cAMP Biotrak Enzyme Immunoassay System (GE Healthcare). Means ± SD of two to four experiments are shown. White lines indicate that intervening lanes have been spliced out.

