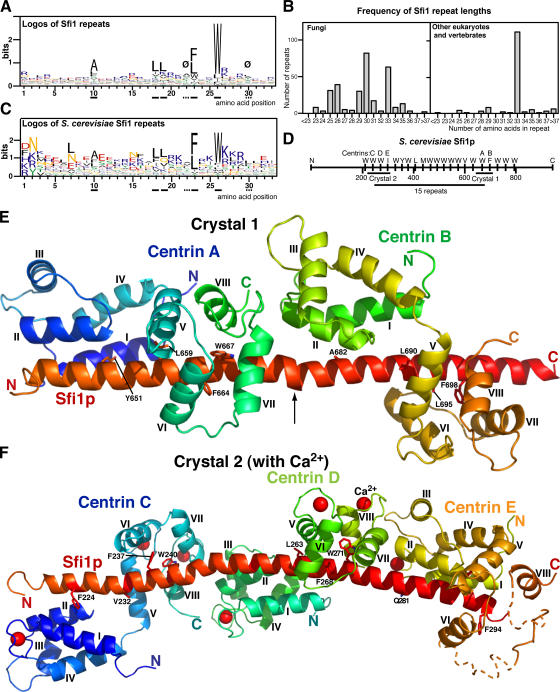
Figure 1.
Sequence analysis of Sfi1 repeats and structure of the Sfi1p–centrin complex. (A) Logos of 454 Sfi1 repeats from 16 fungi, Chlamydomonas, Giardia lamblia, Ciona intestinalis, chicken, dog, mouse, and human (see the supplemental text, available at http://www.jcb.org/cgi/content/full/jcb.200603153/DC1). Ø marks positions 22 and 30, where there is an usually low content of charged aliphatic amino acids (DEKR; 2.9% at position 22 and 7.0% at position 30 compared with 29.5% for all positions). Underlined full and dashed lines are for orientation in Figs. 1 and 2. (B) Frequency of Sfi1-repeat lengths. Lengths were measured between the tryptophan positions (position 26). (C) Logos of 21 S. cerevisiae Sfi1 repeats. (D) Diagram of S. cerevisiae Sfi1p, showing 21 repeats and the positions of constructs used to prepare crystals 1 and 2 and the 15-repeat construct. (E) Crystal 1. Ribbon diagram of the Sfi1p–centrin complex containing two Sfi1 repeats and two centrins at low Ca2+ concentration. Conserved residues in the repeats are shown (positions 10, 18, 23, and 26; panel A). The arrow indicates a bulge and bend in the α helix. Centrin helices are marked. (F) Crystal 2. Sfi1p–centrin complex containing three Sfi1 repeats (N218-H306) and three centrins with Ca2+ bound. Notations are as explained in E, and Ca2+ ions are indicated by red spheres. The end of the third Sfi1 repeat and parts of the C-terminal domain of centrin E were indistinct (dotted lines). Coordinates for the two structures have been deposited with the RCSB Protein Data Bank under accession numbers 2GV5 (crystal 1) and 2DOQ (crystal 2).

