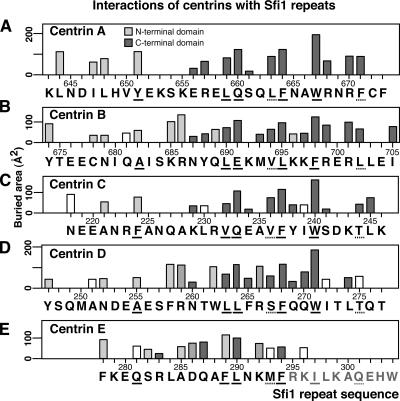
Figure 2.
Interactions of centrins with Sfi1 repeats. (A–E) Interactions with centrins A–E plotted as buried area (Collaborative Computational Project, Number 4, 1994). Light gray bars show interactions with the centrin N-terminal domain, dark gray with the C-terminal, and intermediate gray with both; interacting amino acids (within 4.0 Å) were identified by Ligplot (Wallace et al., 1995). Unshaded bars represent buried areas where Ligplot fails to show residues within 4.0 Å. Underlined amino acids are the conserved positions in the Sfi1 repeat.

