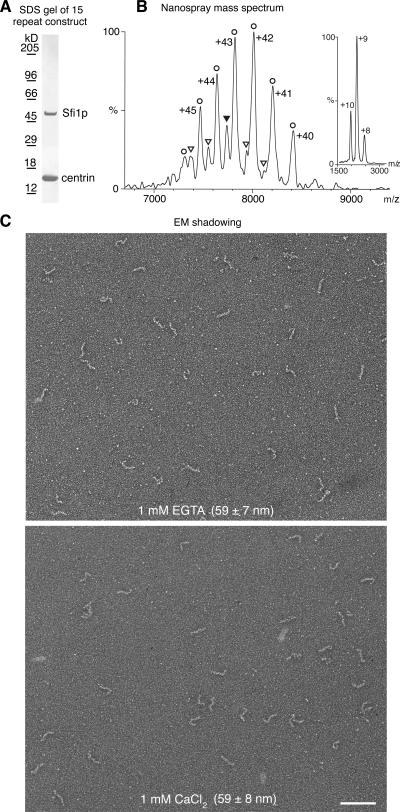
Figure 5.
Analysis of an Sfi1p–centrin complex containing 15 repeats. (A) Coomassie-stained SDS gel of the 15-repeat Sfi1p–centrin complex (Fig. 1 D). (B) Nanospray mass spectrum of the 15-repeat Sfi1p–centrin complex under nondenaturing conditions. The observed charge series correspond to centrin monomers at low m/z (inset: observed mass, 18,619.3 D; theoretical mass, 18,619.9 D, with N-terminal methionine removed) and to 1:15 (circles) and 1:14 (triangles) Sf1p–centrin complexes at high m/z (main panel: observed masses, 336,290 ± 191 and 317,308 ± 206 D; theoretical masses, 332,713 and 314,093 D, with excess mass due to solvent/buffer adduct retention under nondenaturing conditions). The errors in the observed masses are the standard deviations of the mass calculated for individual peaks in a series and are mainly due to variation in the degree of residual solvation of different charge states. The charge states for the 1:14 complex are omitted for clarity. The ion indicated by the filled triangle carries a charge of +41. (C) EM shadowing of the 15-repeat Sfi1p–centrin complex. Images were obtained with either 1 mM EGTA or 1 mM CaCl2, and the observed average length of the filaments is shown. Bar, 100 nm.

