Figure 6.
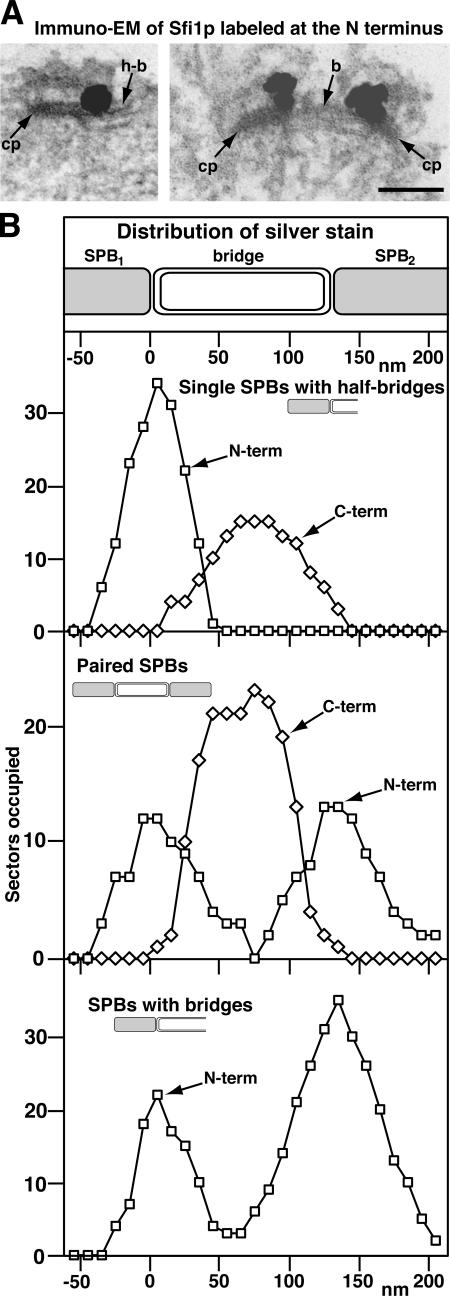
Immuno-EM of Sfi1p labeled at the N and C termini with GFP. (A) Images of a single (left) and paired SPBs (right) of cells containing Sfi1p labeled with GFP at the N terminus and stained with anti-GFP, anti-rabbit Fab-Nanogold, and silver intensification. cp, central plaque of the SPB; h-b, half-bridge; b, bridge. Bar, 100 nm. (B) Distribution of silver stain for stained cells labeled with GFP at the N terminus of Sfi1p as above and at the C terminus as described previously (Kilmartin, 2003). For each image, the region of staining at the SPB was divided into 10-nm sectors perpendicular to the long axis of the central plaque and along the bridge, starting from the edge of the central plaque. The presence or absence of staining in each of these sectors along the SPB and bridge was recorded. The numbers of SPBs examined in each category was slightly less than the maximum numbers of sectors occupied.

