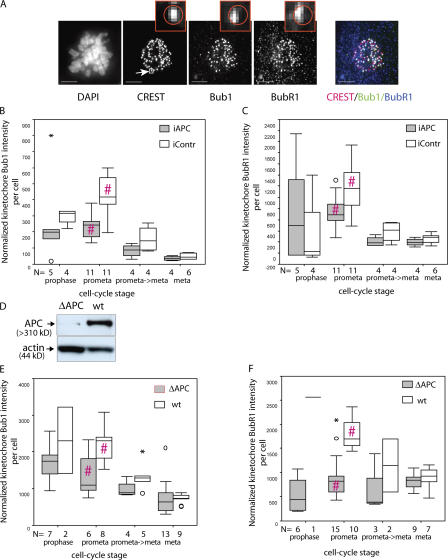
Figure 2.
Reduction in kinetochore-associated Bub1 and BubR1 in APC-deficient cells. (A) Examples of cells stained with antibodies against the kinetochore marker CREST, Bub1, and BubR1, which were used to measure kinetochore-associated Bub1 and BubR1. U2OS cells were fixed and stained with DAPI, anti-CREST, anti-Bub1, and anti-BubR1 antibodies as indicated. Each image represents a projection of several 0.2-μm sections. Insets show magnified regions of the image (indicated in the CREST image; arrow); a circle in the insets indicates the region identified by CREST staining that was then used as the kinetochore domain to calculate the amount of Bub1 or BubR1 intensity at this site. Bars, 5 μm. (B and C) The relative amount of Bub1 (B) and BubR1 (C) at mitotic kinetochores of U2OS cells decreases after APC depletion. Cells treated with control (white) or APC-targeted (gray) siRNA as in Fig. 1 A were fixed and stained as in A (this figure). The total intensity of Bub1 and BubR1 at kinetochores was measured in 3D images of individual cells using the OME system optimized for high throughput analysis as described in Materials and methods. Box plots show the amount of kinetochore-associated Bub1 and BubR1 per cell normalized to the amount of CREST in this region using a five-point summary. For each box plot, the number of cells on which it was based is indicated below the x axis. (D) Immunoblot of a constitutive APC mutant (ΔAPC) and wild-type (wt) counterpart mouse fibroblasts with anti-APC antibodies reveals the reduced level of APC in mutant fibroblasts. Actin was used as a loading control. (E and F) APC-deficient (ΔAPC; gray) and wild-type (wt; white) fibroblasts were prepared as in A, and the amount of Bub1 (E) or BubR1 (F) at kinetochores was quantitated as in B and C, with the difference that Bub1- and BubR1-stained cells were collected in separate datasets rather than from the same cells. APC-deficient cells accumulate relatively less Bub1 and BubR1 at their kinetochores during mitosis, particularly during prometaphase. Pairs with a statistically significant difference in two-tailed t tests are indicated by red hashes (#). B, P < 0.001; C, P < 0.01; E, P < 0.05; F, P < 0.001. Mild outliers are indicated by circles, and extreme outliers are shown by asterisks.

