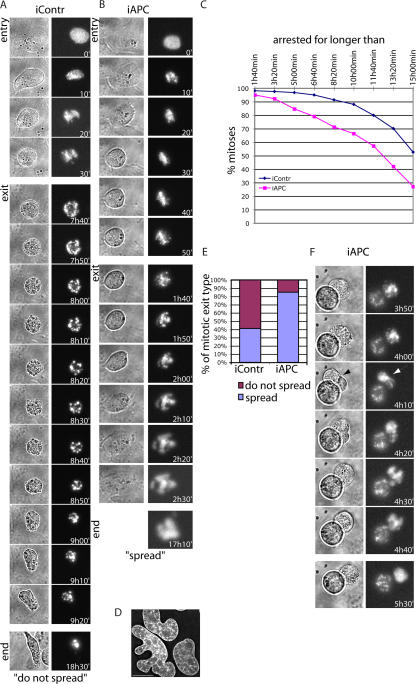
Figure 4.
Visualization of mitotic slippage in APC-deficient cells arrested with taxol. (A) Representative images of control siRNA-treated U2OS cells showing mitotic arrest followed by cell death. 2 d after cotransfection with H2B-RFP and siRNA, cells were treated with 1.25 μg/ml taxol. Mitotic arrest was followed by the imaging of fluorescent chromatin-associated H2B (right) or brightfield (left) for 19 h starting 1 h after taxol addition. Both entry and exit from mitotic arrest are depicted as well as images of cells at the end of the recording (end). Note the membrane blebbing, chromatin tightening, and fragmentation as well as the change in the cell shape at the end of mitotic exit. (B) Representative image of a U2OS cell treated with APC-targeting siRNA that spreads after mitotic arrest. Cells were treated and imaged as in A. Images of control and APC-deficient cells were collected in parallel. Mitotic entry and mitotic exit of an APC-inhibited cell are depicted using both brightfield (left) and fluorescent chromatin (right) images at the indicated times as well as fluorescent images of final chromatin structure at the end of the video. Note the chromatin decondensation (most apparent at 2 h and 0 min), cell spreading, and irregular chromatin structure at the end of mitotic exit. (C) Taxol-induced mitotic arrest is shortened by APC inhibition. U2OS cells were treated and imaged as in A, and the times of mitotic entry (as judged by rounding up or/and chromatin condensation) and exit (as judged by membrane blebbing or/and chromatin decondensation) were recorded for each individual cell. The graph shows the percentage of control (blue) and APC-inhibited (pink) cells that remained in mitosis for longer than the indicated times. 175 control and 172 APC-deficient cells were analyzed. (D) An example of chromatin structure in interphase APC-deficient U2OS cells. 3 d after APC inhibition by siRNA, U2OS cells were fixed and stained with DAPI. The image represents a projection of several 0.2-μm sections. Bar, 15 μm. (E) Proportion of different types of mitotic exit in APC-deficient and control U2OS cells. Cells were treated and imaged as in A–C, and the number of cells that spread after exiting mitosis (purple; as in B) and that did not spread after exiting mitosis (pink; as in A) were counted and plotted to show the proportion of each type of mitotic exit. (F) An example of a taxol-arrested APC-deficient cell that attempts to form a cleavage furrow (black arrow in brightfield image; left) and in which the chromatin is stretched (white arrow; right), as if the cell is attempting to divide. After this event, the chromatin decondensed, indicating mitotic exit.

