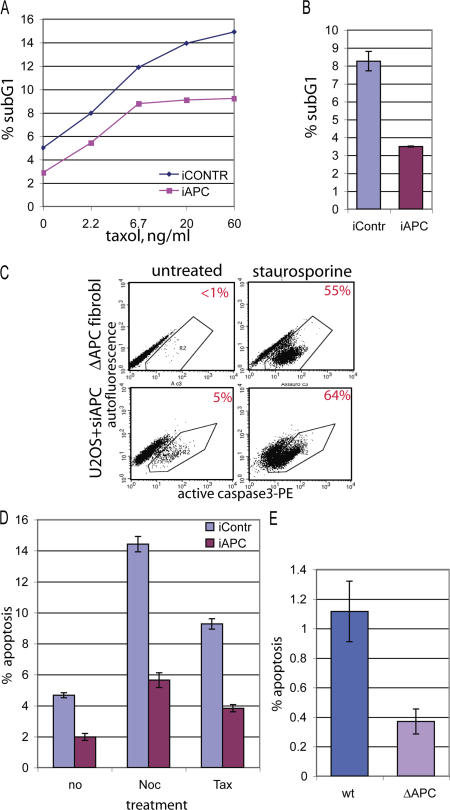
Figure 5.
The loss of APC inhibits apoptosis. (A) U2OS cells transfected with nontargeting (iCONTR) or APC-targeting (iAPC) siRNA were treated with no or increasing amounts of taxol for 10 h. They were ethanol fixed and stained with propidium iodide to measure their DNA profiles by flow cytometry. The fraction of cells with sub-G1 DNA content, which is an indicator of apoptosis, is shown as a percentage of the total number of cells. (B) U2OS cells transfected with nontargeting (iContr) or APC-targeting (iAPC) siRNA were treated with 1.25 μg/ml taxol for 20 h, and the sub-G1 fraction was measured as in A. (C) APC-deficient cells can apoptose. Mouse fibroblasts constitutively lacking APC (ΔAPC fibroblasts; see Fig. 2 D for Western blot) or U2OS cells treated with APC-targeting siRNA (U2OS + siAPC) were treated for 12 h with 0.1 μM staurosporine (right) or were left untreated (left). Cells were fixed and stained with PE-labeled antibody against active (cleaved) caspase 3 and analyzed by flow cytometry. Cells positive for active caspase 3 fall into polygon R2. The percentage of active caspase 3–positive (apoptotic) cells is indicated in the right top corner of each dot blot. Note a dramatic increase in apoptosis after staurosporine treatment in all APC-deficient cells. (D) U2OS cells transfected with nontargeting (iContr) or APC-targeting (iAPC) siRNA were treated with 1.25 μg/ml nocodazole (noc) or taxol (tax) for 20 h or were left untreated (no), were stained with PE-labeled antiactive caspase 3 antibody, and were analyzed as in C. Bars show the percentage of apoptotic (active caspase 3 positive) cells. (E) Constitutively APC-deficient mouse fibroblasts (ΔAPC) and their wild-type counterpart (wt) were stained with PE-labeled antiactive caspase 3 antibody and were analyzed as in C. Bars show the percentage of apoptotic cells. (B and E) Data show a representative example of one out at least three independent experiments; for each experiment, duplicate samples were analyzed by flow cytometry. (B, D, and E) Data are represented as the mean ± SD (error bars).

