Figure 5.
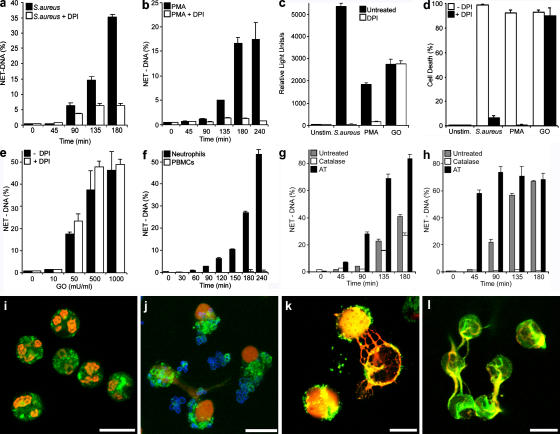
NET-forming cell death depends on ROS production. (a) NET-DNA quantification of neutrophils stimulated with S. aureus (multiplicity of infection [MOI] 20) in the absence or presence of 10 μM of the NADPH oxidase inhibitor DPI, as indicated in the figure. (b) Quantification of NET formation of PMA-stimulated (10 nM) neutrophils in the absence (closed bars) or presence (open bars) of DPI. (c) ROS production 20 min after activation with S. aureus or PMA or 10 min after stimulation with 100 mU/ml GO was comparable (closed bars). After pharmacological inhibition of NADPH oxidase with DPI (open bars), ROS production was blocked when stimulated with S. aureus or PMA, but not with GO-treated cells. (d) Neutrophil cell death is dependent on ROS production. Neutrophils were stimulated with S. aureus for 180 min and PMA or GO for 240 min, and cell death was determined by vital dye exclusion. Cell death was abrogated by DPI in S. aureus– and PMA-, but not GO-, stimulated neutrophils. (e) Neutrophils incubated for 180 min with the indicated concentrations of GO in the absence (closed bars) or presence (open bars) of DPI. NET formation was induced by GO in a dose-dependent manner and was not dependent on NADPH oxidase activity. (f) GO treatment did induce NET formation in neutrophils, but not PBMCs. Neutrophils (closed bars) and PBMCs (open bars) were stimulated with GO for indicated periods and NET formation was quantified. NET-DNA release became detectable 90 min after activation only from neutrophils. (g) Neutrophils were activated with PMA in the presence of exogenous catalases (open bars), an inhibitor of endogenous catalases (AT, closed bars) or in the absence of these components (gray bars). (h) Stimulation of neutrophils with GO in the presence of exogenous catalases (open bars, 100 mU/ml), an inhibitor of endogenous catalases (AT, closed bars, 1 mM) or in the absence of these components (gray bars). In response to both stimuli, PMA and GO exogenous catalases reduced NET formation whereas NET formation was enhanced after inhibition of endogenous catalases as quantified by isolating NET – DNA. (i–l) Immunostaining of NET components (green, neutrophil elastase; red, histone–DNA complex). Bars, 10 μm. (i) Unstimulated neutrophils incubated for 180 min do not show NETs. Neutrophils stimulated with S. aureus (j, blue) for 120 min or PMA (k) for 180 min showed NETs. (l) Stimulation with GO for 180 min induced NET formation. The experiment was repeated at least 5 times with neutrophils from independent donors with similar results. The data shown is a representative triplicate experiment and presented as a mean value ± the SD.

