Figure 4.
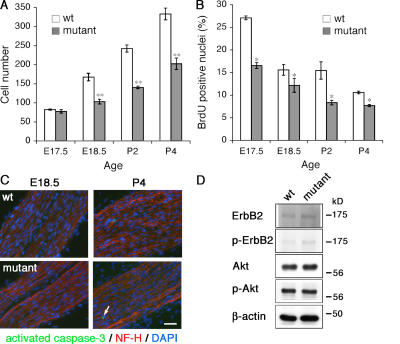
Reduced numbers of Schwann cells in mutant nerves. (A) Mutant nerves have fewer Schwann cells per cross section of tibial nerve from E18.5. (B) Immunofluorescence and counting of labeled nuclei after BrdU incorporation shows decreased proliferation in mutant nerves. (C) Immunofluorescence for activated caspase-3 in the mutant shows no elevated apoptosis from E18.5 through P4 compared with wild-type. A rare caspase-3–positive cell is indicated by the arrow. (D) Western blot of P1 sciatic nerves showing that ErbB2 and AKT phosphorylation are unimpaired in the mutant. The loading control was β-actin. Values are means ± the SEM. n = 3 mice for each age. *, P < 0.05; **, P < 0.01 from paired t test. Bar, 30 μm.

